. 2013 Aug;3(8):870-9.
doi: 10.1158/2159-8290.CD-13-0015. Epub 2013 May 28.

Metabolic and functional genomic studies identify deoxythymidylate kinase as a target in LKB1-mutant lung cancer

Affiliations

Metabolic and functional genomic studies identify deoxythymidylate kinase as a target in LKB1-mutant lung cancer

Yan Liu et al. Cancer Discov. 2013 Aug.

Abstract

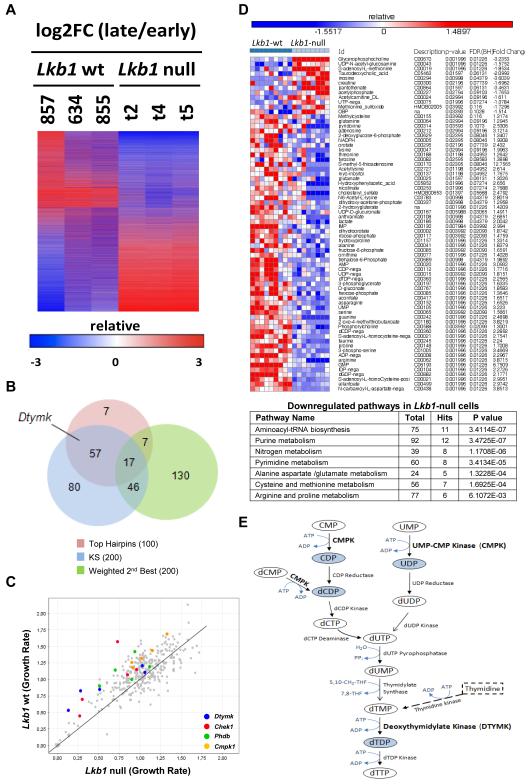
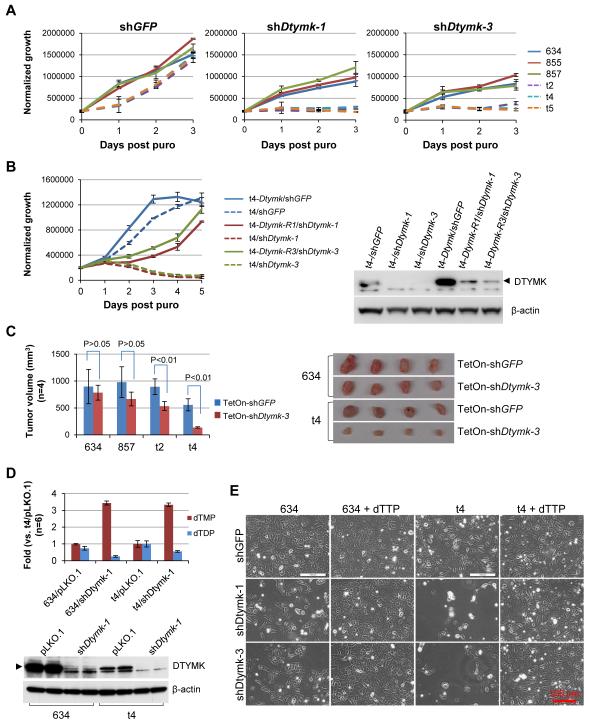
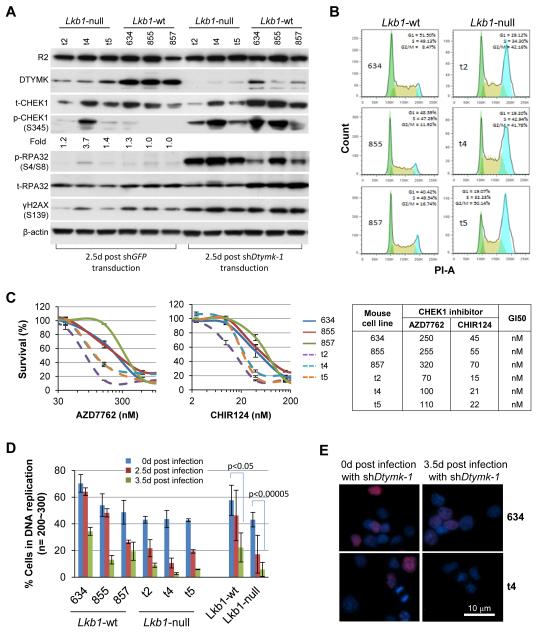
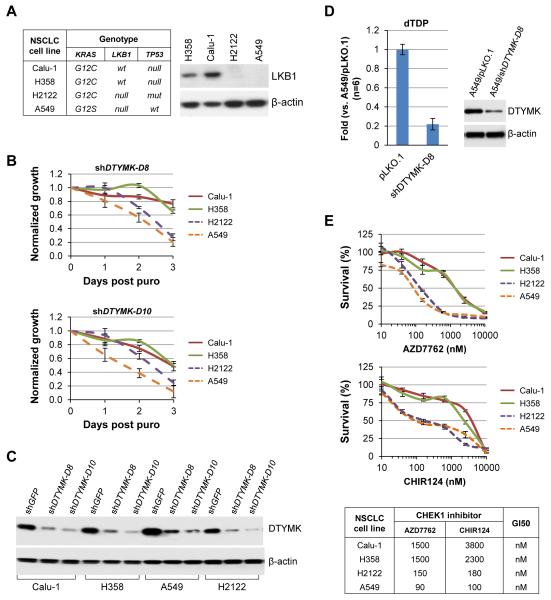
The LKB1/STK11 tumor suppressor encodes a serine/threonine kinase, which coordinates cell growth, polarity, motility, and metabolism. In non-small cell lung carcinoma, LKB1 is somatically inactivated in 25% to 30% of cases, often concurrently with activating KRAS mutations. Here, we used an integrative approach to define novel therapeutic targets in KRAS-driven LKB1-mutant lung cancers. High-throughput RNA interference screens in lung cancer cell lines from genetically engineered mouse models driven by activated KRAS with or without coincident Lkb1 deletion led to the identification of Dtymk, encoding deoxythymidylate kinase (DTYMK), which catalyzes dTTP biosynthesis, as synthetically lethal with Lkb1 deficiency in mouse and human lung cancer lines. Global metabolite profiling showed that Lkb1-null cells had a striking decrease in multiple nucleotide metabolites as compared with the Lkb1-wild-type cells. Thus, LKB1-mutant lung cancers have deficits in nucleotide metabolism that confer hypersensitivity to DTYMK inhibition, suggesting that DTYMK is a potential therapeutic target in this aggressive subset of tumors.


Figures

Figure 1
Figure 1. Identifying Dtymk
A, Unsupervised hierarchical clustering analysis of results from triplicate pooled shRNA library screens of Lkb1-wt and Lkb1-null mouse cancer cell lines based upon log2 fold change (log2FC). Negative numbers (blue) reflect relative depletion of shRNAs at late time points. B, Two class comparison of Lkb1-null versus Lkb1-wt cell lines was used to generate a ranked hairpin list of selectively essential hairpins in an Lkb1-null background. Hairpins were collapsed to gene values using either the weighted second best or the KS statistic in GENE-E. Venn diagram depicts the overlap of most essential genes in the Lkb1-null background nominated by the top 100 independent hairpins, and the top 200 genes from both weighted second best and KS. C, Validation study. Relative viability of Lkb1-wt and Lkb1-null cells infected with 340 individual hairpins for 5 days. Genes of interest are highlighted by the colors indicated. D, Metabolic signature of Lkb1-null lung cancer cells. Unsupervised clustering analysis of metabolomic data from Lkb1-wt and Lkb1-null cells. The heatmap displays those metabolites with the greatest difference between Lkb1-wt and Lkb1-null cell lines, along with compound name (ID), Description (KEGG identification number), and p-value, etc. for the comparison between the two sets of lines. The lower panel shows significantly enriched metabolic pathways in down-regulated components of the Lkb1-null metabolic signature using Pathway Analysis module from MetaboAnalist tool (http://www.metaboanalyst.ca). E, A comprehensive metabolic map of de novo (solid line) and the salvage (dashed line) pyrimidine deoxyribonucleotide biosynthetic pathway. This map was created with CellDesigner version 4.2 using a template from Panther Classification System Database (www.pantherdb.org). DTYMK is highlighted in Bold. Metabolites depicted in light blue were significantly down-regulated in Lkb1-null cells, respectively.
Figure 2
Figure 2. Dtymk is the synthetic lethal target of Lkb1 loss
A, Lkb1-wt (634, 855, and 857) and Lkb1-null (t2, t4, and t5) cells were transduced with the indicated shRNA for 2 days and then plated into 96-well plates at 2000 cells/well in 150 μl medium with 3 μg/ml puromycin (puro). Viable cells were measured daily using Promega’s CellTiter-Glo Assay. The data represent mean ± SD for 3 replicates. B, Lkb1-null t4 cells were first transduced with pLenti6-Dtymk, pLenti6-Dtymk-R1, or pLenti6-Dtymk-R3, and selected with blasticidin. The blasticidin-resistant cells were pooled and further transduced with the indicated shRNA for 2 days and then plated for proliferation assay as described in A. The data represent mean ± SD for 3 replicates. C, 1×10⁶ Lkb1-wt (634 and 857) and Lkb1-null (t2 and t4) cells transduced with the indicated shRNA were implanted into athymic nude mice for 3 weeks. Tumor volume (mm3) was calculated as (length × width2)/2. The data represent mean ± SD for 4 mice. Lkb1-wt 634 and Lkb1-null t4 tumors with the indicated shRNAs were shown. D, Graph of dTMP and dTDP levels in Lkb1-wt 634 and Lkb1-null t4 cells transduced with the indicated shRNA for 3 days. The data represent mean ± SD for 6 replicates. Expression of DTYMK in these cells at the time of metabolite extraction was determined by Western blotting. E, Morphology of Lkb1-wt 634 and Lkb1-null t4 cells transduced with the indicated shRNA and then cultured in medium with or without additional 100 μM dTTP for 4 days.
Figure 3
Figure 3. Characterizations of Lkb1-wt and Lkb1-null cell lines
A, Western blot analyses of the indicated protein expression in Lkb1-wt (634, 855, and 857) and Lkb1-null (t2, t4, and t5) cell liens after shDtymk-1 knockdown. Phospho-CHEK1 Western blot bands were quantified by ImageJ. B, Lkb1-wt (634, 855, and 857) and Lkb1-null (t2, t4, and t5) cell lines in log-phase growth were fixed with cold 70% ethanol, stained with PI, and then analyzed with flow cytometry. 20,000 cells per line were analyzed. C, Lkb1-wt (634, 855, and 857) and Lkb1-null (t2, t4, and t5) cell lines were plated into 96-well plates at 2000 cells/well in 150 ml medium containing the indicated concentrations of AZD7762 or CHIR124 for 3 days. Viable cells were then counted with Dojindo’s Cell Counting Kit-8 assay. The data represent mean ± SD for 3 repeats. GI50 was calculated with GraphPad. D, Lkb1-wt and Lkb1-null cells in 6-well plates were transduced with shDtymk-1. Two sets of the cells were plated into multiple chamber slides: one was 2 days and the other was 3 days post transduction. After overnight culturing, the cells were labeled with 100 μM IdU for 20 min then fixed for indirect immunofluorescence staining with anti-BrdU. The data represent mean ± SD for 200~300 cells. E, Representative merged images from the cells stained with IdU (red) and DAPI (blue) as described in D are shown.
Figure 4
Figure 4. Knockdown of DTYMK in LKB1-wt and LKB1-mutant NSCLC cell lines
A, Western blot analyses of LKB1 expression in LKB1-wt (H358 and Calu-1) and LKB1-deficient (H2122 and A549) NSCLC cell lines. B, LKB1-wt (H358 and Calu-1) and LKB1-deficient (H2122 and A549) NSCLC cell lines were transduced with the indicated shRNAs for 1 day and then selected with 5 μg/ml puromycin (puro) for 2 days in 6-well plates. The cells were collected by trypsin and re-plated into 96-well plates at 2000 cells/well in 150 μl medium containing 5 μg/ml puromycin (puro) and measured daily using Promega’s CellTiter-Glo Assay. The data represent mean ± SD for 3 replicates. The cells left from the re-plating were lysed for Western blot analysis of DTYMK expression (C). D, Graph of dTDP levels in A549 cells transduced with the indicated shRNA for 4 days. The data represent mean ± SD for 6 replicates. Expression of DTYMK in these cells at the time of metabolite extraction was determined by Western blotting. E, LKB1-wt (H358 and Calu-1) and LKB1-deficient (H2122 and A549) NSCLC cell lines were plated into 96-well plates at 2000 cells/well in 150 ml medium containing the indicated concentrations of AZD7762 or CHIR124 for 3 days. Viable cells were counted daily using Dojindo’s Cell Counting Kit-8 Assay. The data represent mean ± SD for 3 repeats. GI50 was calculated with GraphPad.

Comment in

References

    1. Wodarz A, Nathke I. Cell polarity in development and cancer. Nature cell biology. 2007;9:1016–24. - PubMed
    1. Mihaylova MM, Shaw RJ. The AMPK signalling pathway coordinates cell growth, autophagy and metabolism. Nature cell biology. 2011;13:1016–23. - PMC - PubMed
    1. Vander Heiden MG, Cantley LC, Thompson CB. Understanding the Warburg effect: the metabolic requirements of cell proliferation. Science. 2009;324:1029–33. - PMC - PubMed
    1. Gurumurthy S, Xie SZ, Alagesan B, Kim J, Yusuf RZ, Saez B, et al. The Lkb1 metabolic sensor maintains haematopoietic stem cell survival. Nature. 2010;468:659–63. - PMC - PubMed
    1. Jones RG, Thompson CB. Tumor suppressors and cell metabolism: a recipe for cancer growth. Genes & development. 2009;23:537–48. - PMC - PubMed

Publication types

MeSH terms