. 2013:4:1908.
doi: 10.1038/ncomms2921.

Drug-induced histone eviction from open chromatin contributes to the chemotherapeutic effects of doxorubicin

Affiliations
Free PMC article

Drug-induced histone eviction from open chromatin contributes to the chemotherapeutic effects of doxorubicin

Baoxu Pang et al. Nat Commun. 2013.
Free PMC article

Abstract

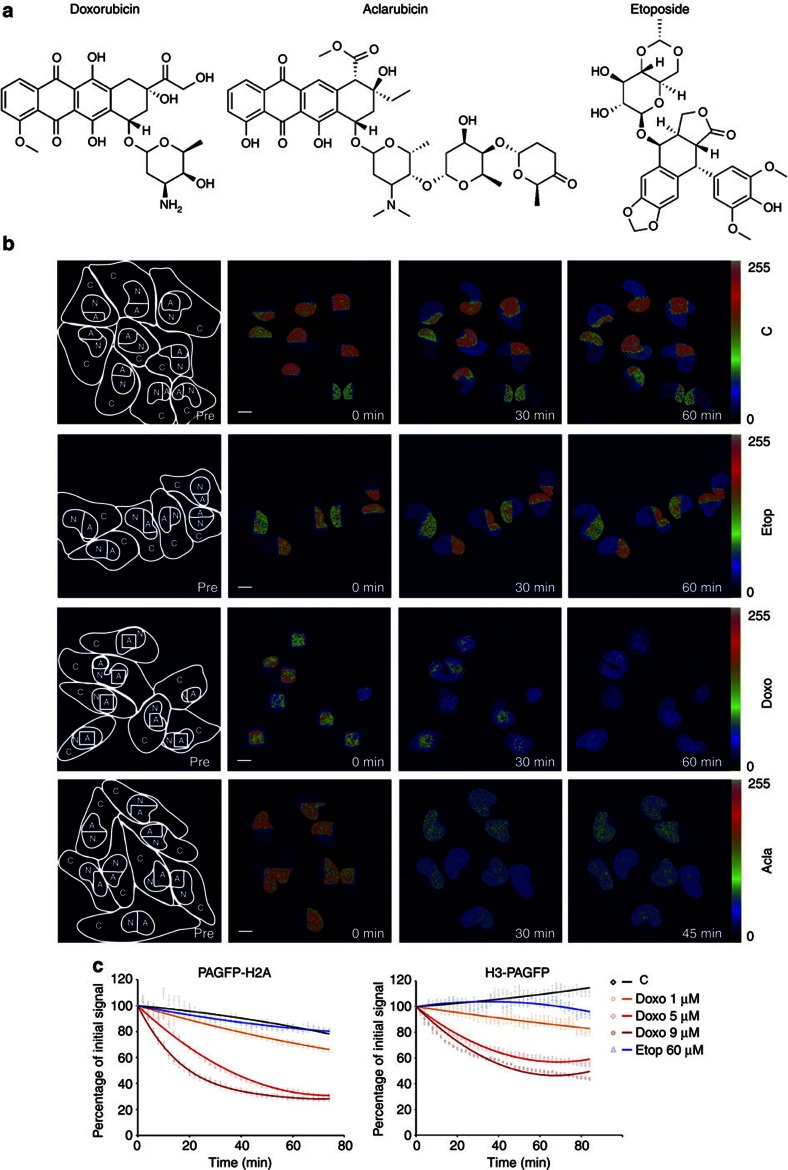
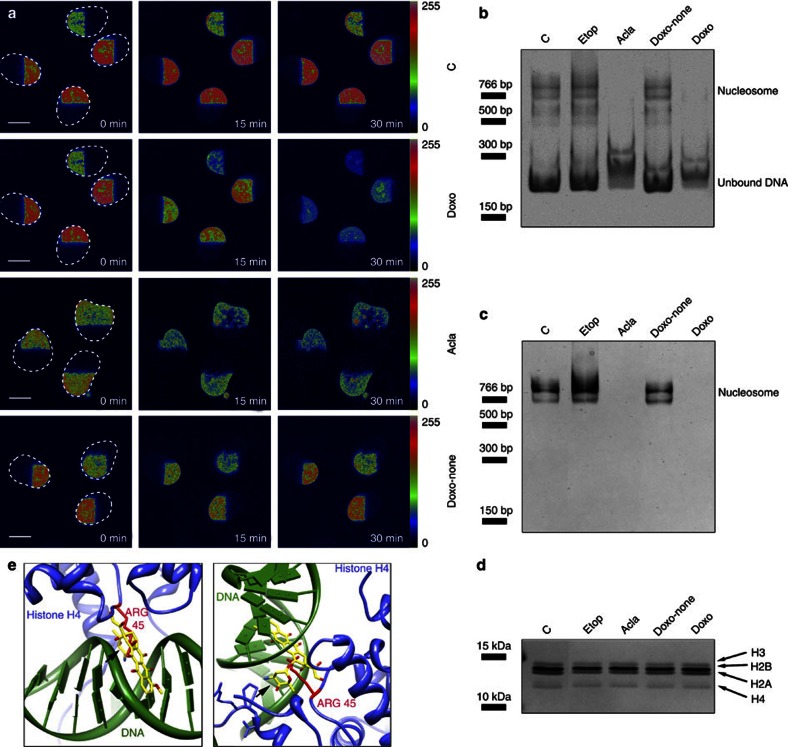
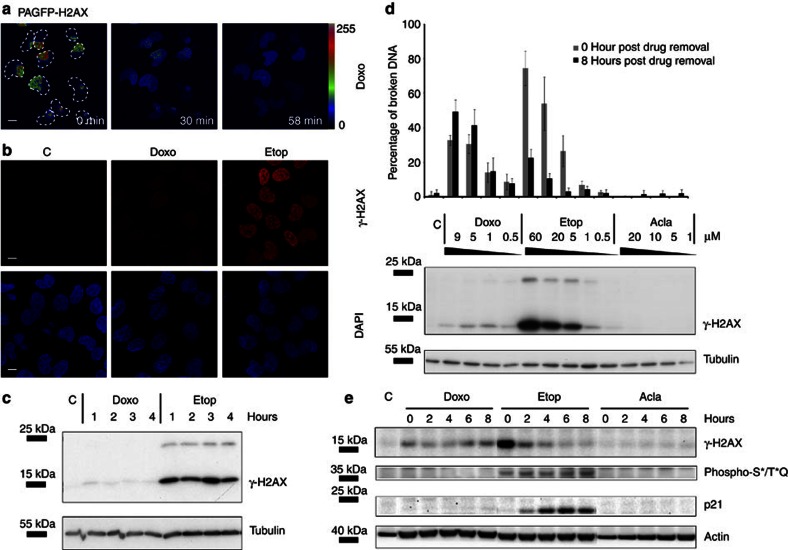
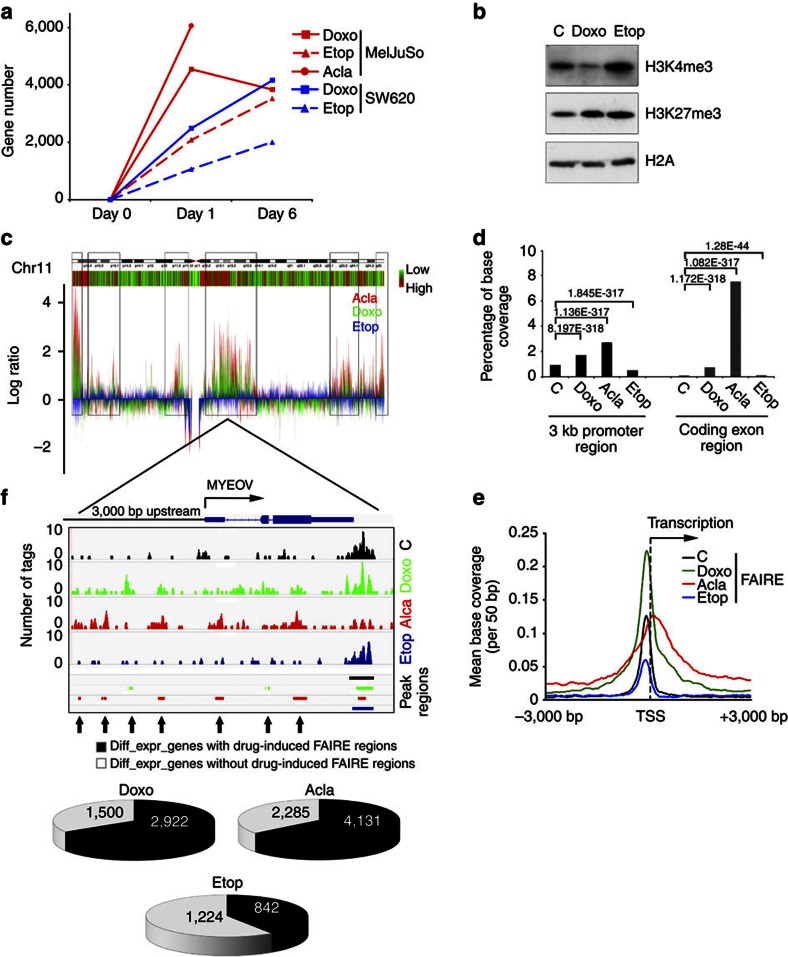
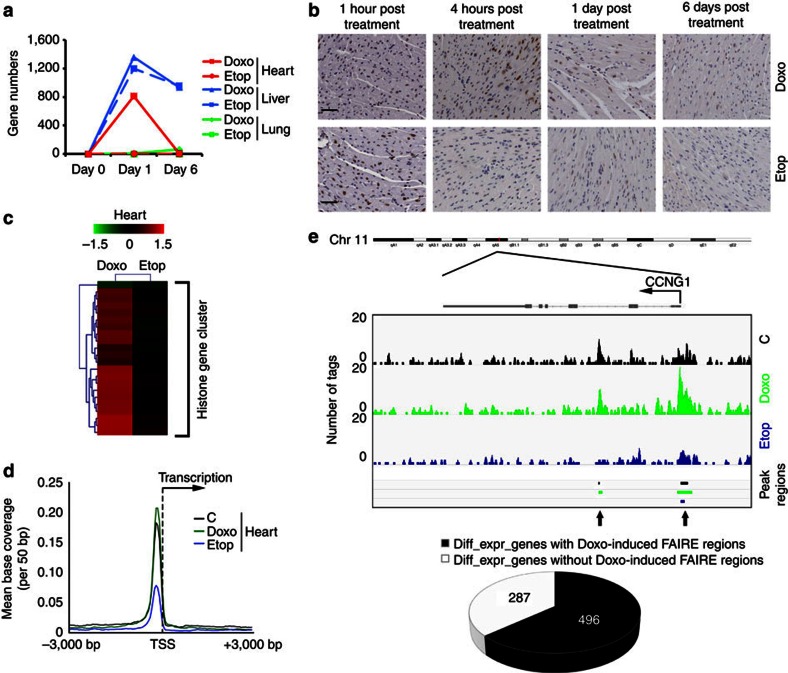
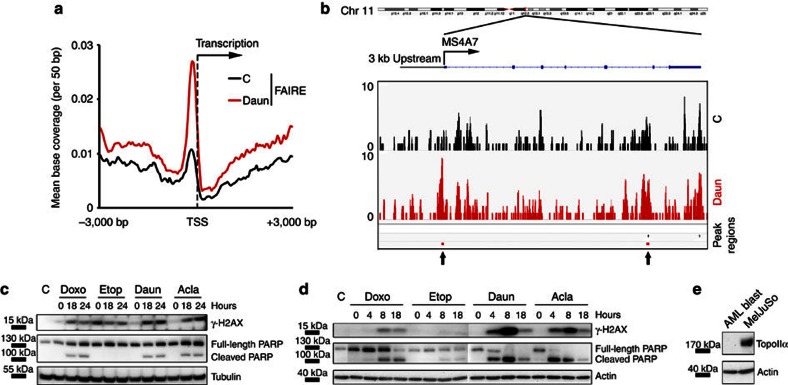
DNA topoisomerase II inhibitors are a major class of cancer chemotherapeutics, which are thought to eliminate cancer cells by inducing DNA double-strand breaks. Here we identify a novel activity for the anthracycline class of DNA topoisomerase II inhibitors: histone eviction from open chromosomal areas. We show that anthracyclines promote histone eviction irrespective of their ability to induce DNA double-strand breaks. The histone variant H2AX, which is a key component of the DNA damage response, is also evicted by anthracyclines, and H2AX eviction is associated with attenuated DNA repair. Histone eviction deregulates the transcriptome in cancer cells and organs such as the heart, and can drive apoptosis of topoisomerase-negative acute myeloid leukaemia blasts in patients. We define a novel mechanism of action of anthracycline anticancer drugs doxorubicin and daunorubicin on chromatin biology, with important consequences for DNA damage responses, epigenetics, transcription, side effects and cancer therapy.


Figures

Figure 1
Figure 1. Histone eviction by Doxo.
(a) Chemical structures of three TopoII inhibitors doxorubicin, its variant aclarubicin and the structure of etoposide. (b) Part of the nucleus from MelJuSo cells expressing PAGFP-H2A was photoactivated. The cells were exposed to 9 μM Doxo, 60 μM Etop or 20 μM Acla for the time points indicated and the fate of PAGFP-H2A was monitored by confocal laser scanning microscopy (CLSM). The lines in the left panel show the cell boundaries (C), the nucleus (N) and the activated area (A). The fluorescence intensities are shown in false colours as indicated by the ‘Look-Up Table’. C, untreated control. Scale bar, 10 μm. (c) Quantification of the fluorescence in the photoactivated area of MelJuSo cells expressing PAGFP-H2A or H3-PAGFP after exposure to Etop or different concentrations of Doxo. Cells were monitored as in Fig. 1b. Data points are the mean fluorescence. Trend lines are drawn over experimental data (n=30 to 50 cells, error bar indicates s.e.m.).
Figure 2
Figure 2. Intercalation of Doxo into DNA suffices to induce histone eviction from nucleosomes.
(a) MelJuSo cells expressing PAGFP-H2A were permeabilized by 0.1% Triton X-100 before parts of the nucleus were photoactivated by 405 nm light. The photoactivated nuclei were followed in time by confocal laser scanning microscopy (CLSM) before or after exposure to 9 μM Doxo, 20 μM Acla or 20 μM Doxorubicinone (Doxo-none), as indicated. Fluorescence intensities shown in false colours and the boundaries of the nuclei are indicated. C, untreated control. Scale bar, 10 μm. (b) In vitro assembled single nucleosomes were treated with 60 μM Etop, 20 μM Doxo, 20 μM Acla or 20 μM Doxorubicinone for 4 h as indicated. C, untreated control. Samples were analysed by native polyacrylamide gel electrophoresis (PAGE) and stained with ethidium bromide (EtBr). Position of assembled nucleosomes and free DNA are indicated. (c) The same gel in b was subsequently stained with silver to visualize the histones in the nucleosomes. Position of assembled nucleosomes is indicated. (d) The same samples as in b and c were analysed by SDS–PAGE and silver-stained to show that equal amounts of histones and reconstituted single nucleosomes were present in the different lanes. Positions of histone variants are indicated. (e) A model of Doxo intercalation in chromatin, with the sugar moiety of Doxo competing with H4 amino acids for access to space in the DNA minor groove. Doxo has been cocrystallized with a segment of the DNA double helix (PDB: 1D12). The nucleosome structure has been crystallized (PDB:1AOI) but without Doxo. Doxo, based on the Doxo-DNA structure, was docked into the nucleosome structure (using programme UCSF Chimera). Shown is a snapshot of the relevant area of the Doxo-chromatin model under two angles. DNA is visualized in green, Doxo in yellow, histone H4 in blue and the H4-arginine residue (at position 45) that enters the DNA minor groove is shown in red. The amino sugar of Doxo (shown by arrow) also fills the DNA minor groove and makes various interactions with DNA bases.
Figure 3
Figure 3. Doxo induces H2AX eviction and attenuates DDR.
(a) Part of the nucleus of MelJuSo cells expressing PAGFP-H2AX was activated before exposure to Doxo. The boundaries of nuclei are indicated. Fluorescence intensities are shown in false colours. Scale bar, 10 μm. (b) MelJuSo cells were treated with 9 μM Doxo or 60 μM Etop for 2 h before fixation and stained for γ-H2AX (top panel in red). Bottom panel in blue indicates DAPI staining of the nuclei of cells. C, untreated control. Scale bar, 10 μm. (c) MelJuSo cells were treated with 9 μM Doxo or 60 μM Etop and lysed at indicated time points before analyses of γ-H2AX by SDS–polyacrylamide gel electrophoresis (PAGE) and western blotting (WB). Tubulin is used as a loading control and the positions of molecular weight markers are indicated. (d) MelJuSo cells were exposed to various concentrations of Doxo, Etop or Acla for 2 h. C, untreated control. Drugs were removed by extensive washing. DNA double-strand breaks, immediately after 2 h drug treatment or 8 h post drug removal were quantified by constant-field gel electrophoresis and expressed as percentage of total DNA (n=3 independent experiments, error bar indicates s.d.). Western blotting indicates the γ-H2AX response after 2 h drug treatment at different concentrations; tubulin is shown as loading control. (e) MelJuSo cells were exposed to 9 μM Doxo, 60 μM Etop or 20 μM Acla for 2 h. Drugs were removed and further cultured for the times indicated. Cells were lysed, separated by SDS–PAGE and WB was probed with the antibodies indicated. Actin is used as loading control and positions of marker are indicated. C, untreated control.
Figure 4
Figure 4. Selective histone eviction and transcriptome changes by Doxo and Acla.
(a) MelJuSo or SW620 cells were exposed to 9 μM Doxo, 10 μM Acla or 60 μM Etop for 2 h. The drugs were removed and cells were cultured for 1 day or 6 days. Line was discontinued day 1 after Acla exposure due to apoptosis later during culture. Microarray analyses were performed for all samples. Plotted are the genes with more than twofold difference in expression compared with non-treated cells. (b) Endogenous histone modification changes by Doxo. MelJuSo cells were treated with 9 μM Doxo or 60 μM Etop for 4 h. Chromatin was isolated, separated by SDS–polyacrylamide gel electrophoresis (PAGE) and western blotting (WB) probed with antibodies against the histone modifications indicated. Histone H2A is used as loading control. (c) MelJuSo cells were exposed to 9 μM Doxo, 20 μM Acla or 60 μM Etop for 4 h before histone-free DNA fragments were isolated by FAIRE followed by next generation sequencing. Shown is chromosome 11, with a green–red bar showing the corresponding relative gene density. The sequenced reads (Acla, red; Doxo, green; Etop, blue) of the different treatments were normalized and compared with control cells. The boxed areas indicate sites more efficiently isolated by FAIRE and their positions in the gene density bar. (d) Annotation of FAIRE-seq peak regions. The peak-region coverage was enriched in the coding exon and promoter regions compared with control cells, due to anthracycline treatments. P-values were calculated with Fisher’s exact test. (e) Distribution and enrichment of FAIRE regions around TSS. The peak regions from FAIRE-seq were enriched around the TSS for all RefSeq genes. (f) Drug-induced peak regions defined by FAIRE-seq after 4 h Doxo or Acla treatment were compared with the differentially expressed genes in MelJuSo cells 24 h after the respective drug exposure (relative to the control cells). This is illustrated for gene MYEOV located on chromosome 11. The FAIRE-seq reads and peak regions called for the different conditions are indicated. Black area in the pie charts defines differentially expressed genes with drug-induced FAIRE peak regions (relative to control cells) within 3 kb upstream of the TSS or on the gene bodies. The new peak regions induced by Doxo and Acla exposure are indicated by arrows.
Figure 5
Figure 5. In vivo responses to Doxo or Etop treatments.
(a) Expression data were generated from lungs, livers or hearts of mice 1 day or 6 days after intravenous bolus injection of Doxo or Etop and compared with expression data in respective organs from untreated mice. Significantly changed genes were calculated with linear models for microarray data, based on two mice per data point. (b) Hearts of drug-treated mice were collected at indicated time points for fixation and staining with anti-γ-H2AX antibodies. Time of sampling and drug treatment is indicated. Scale bar, 50 μm. (c) Heat map showing the expression of histone gene cluster in the hearts of Doxo- or Etop-treated mice relative to control mice. Colour indicates the log-fold change compared with control. (d) FAIRE-seq peak regions from the hearts of mice 4 h after Doxo exposure were enriched around TSS of all RefSeq genes in mice. (e) Peak regions of FAIRE-seq from mouse hearts 4 h post Doxo or Etop injection are compared with genes differentially regulated at 1 day after injection. Top: Illustration of FAIRE-seq reads, as well as the peak regions of the gene CCNG1 for the three conditions. TSS is indicated. Black area in the pie charts defines differentially expressed genes with Doxo-induced FAIRE peak regions (relative to control cells) within 3 kb upstream of the TSS or on the gene bodies (P-value=1.914E-26 related to the whole genome, calculated with Fisher’s exact test). The new peak regions induced by Doxo exposure are indicated by arrows.
Figure 6
Figure 6. Histone eviction effect of anthracyclines on AML patients and blasts.
(a) FAIRE-seq peak regions from blasts of an AML patient isolated before (black) and 2 h post (red) Daun infusion. Enrichment of peak regions around TSS of all RefSeq genes is shown. (b) Illustration of FAIRE-seq reads, as well as the peak regions of the gene MS4A7 of AML blasts isolated before and 2 h after completion of Daun infusion in an AML patient. The location of TSS and the 3 kb upstream region, as well as the intron and exon regions of the gene are indicated. The new peak regions induced by Daun exposure are indicated by arrows. (c) MelJuSo cells were exposed to 9 μM Doxo, 60 μM Etop, 10 μM Daun or 10 μM Acla for 2 h. Drugs were removed and cells were further cultured for the time points indicated. Cells were lysed, separated by SDS–polyacrylamide gel electrophoresis (PAGE) and western blotting (WB) was probed with the antibodies indicated. Tubulin is used as a loading control and positions of marker are indicated. The positions of poly (ADP-ribose) polymerase (PARP) and the PARP cleavage product are indicated. C, untreated control. (d) Primary blast cells isolated freshly from an AML patient were exposed to 9 μM Doxo, 60 μM Etop, 10 μM Daun or 10 μM Acla for 2 h. Drugs were removed and cells were further cultured for the time points indicated. Cells were lysed, separated by SDS–PAGE and WB was probed with the antibodies indicated. Actin is used as a loading control and positions of PARP, the PARP cleavage product and marker proteins are indicated. C, untreated control. (e) MelJuSo cells and primary blast cells isolated freshly from AML patient were analysed by WB to compare the level of TopoIIα. Actin is used as a loading control and positions of marker proteins are indicated.

References

    1. Garnett M. J. et al.. Systematic identification of genomic markers of drug sensitivity in cancer cells. Nature 483, 570–575 (2012). - PMC - PubMed
    1. Farmer H. et al.. Targeting the DNA repair defect in BRCA mutant cells as a therapeutic strategy. Nature 434, 917–921 (2005). - PubMed
    1. Arcamone F. et al.. Adriamycin, 14-hydroxydaimomycin, a new antitumor antibiotic from S. Peucetius var. caesius. Biotechnol Bioeng. 11, 1101–1110 (1969). - PubMed
    1. Hande K. R. Clinical applications of anticancer drugs targeted to topoisomerase II. Biochim. Biophys. Acta. 1400, 173–184 (1998). - PubMed
    1. Minotti G., Menna P., Salvatorelli E., Cairo G. & Gianni L. Anthracyclines: molecular advances and pharmacologic developments in antitumor activity and cardiotoxicity. Pharmacol. Rev. 56, 185–229 (2004). - PubMed

Publication types

MeSH terms

Associated data