. 2013 Nov;98(11):1677-85.
doi: 10.3324/haematol.2013.083972. Epub 2013 May 28.

Mesenchymal stromal cells from patients with myelodyplastic syndrome display distinct functional alterations that are modulated by lenalidomide

Affiliations

Mesenchymal stromal cells from patients with myelodyplastic syndrome display distinct functional alterations that are modulated by lenalidomide

Ruben A Ferrer et al. Haematologica. 2013 Nov.

Abstract

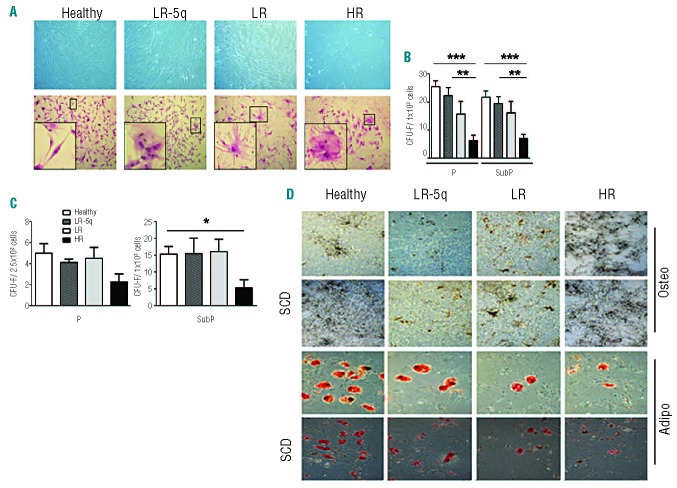
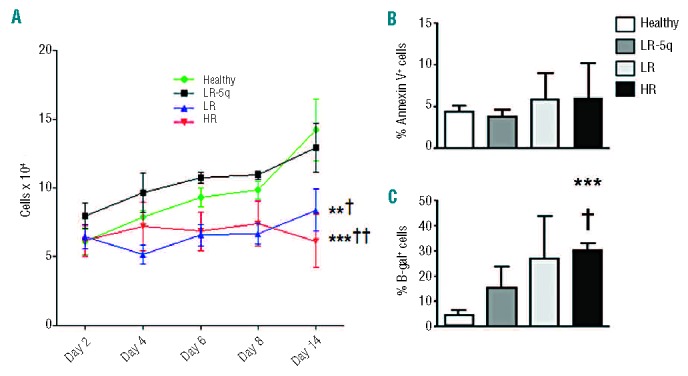
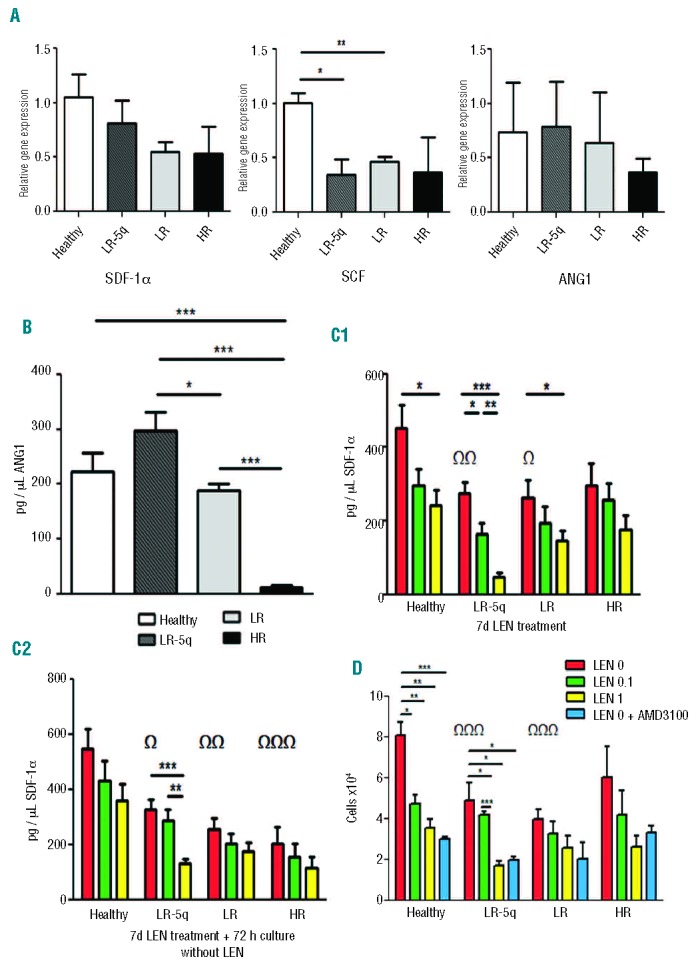
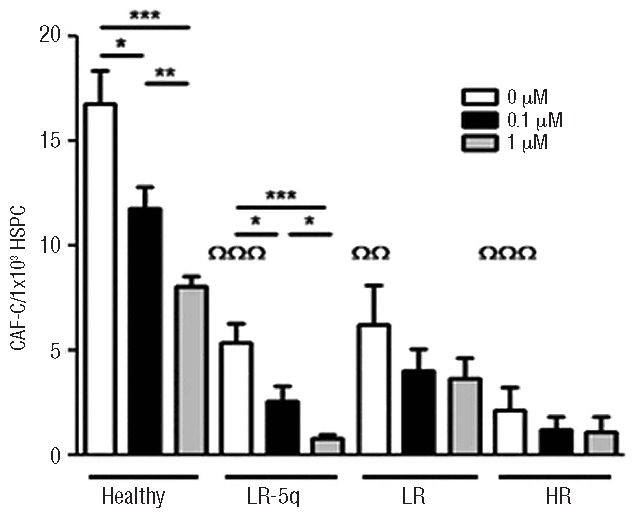
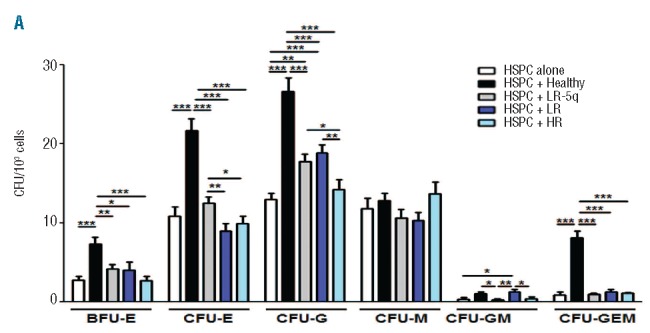
The contribution of the bone marrow microenvironment in myelodysplastic syndrome is controversial. We therefore analyzed the functional properties of primary mesenchymal stromal cells from patients with myelodysplastic syndrome in the presence or absence of lenalidomide. Compared to healthy controls, clonality and growth were reduced across all disease stages. Furthermore, differentiation defects and particular expression of adhesion and cell surface molecules (e.g. CD166, CD29, CD146) were detected. Interestingly, the levels of stromal derived factor 1-alpha in patients' cells culture supernatants were almost 2-fold lower (P<0.01) than those in controls and this was paralleled by a reduced induction of migration of CD34(+) hematopoietic cells. Co-cultures of mesenchymal stromal cells from patients with CD34(+) cells from healthy donors resulted in reduced numbers of cobblestone area-forming cells and fewer colony-forming units. Exposure of stromal cells from patients and controls to lenalidomide led to a further reduction of stromal derived factor 1-alpha secretion and cobblestone area formation, respectively. Moreover, lenalidomide pretreatment of mesenchymal stromal cells from patients with low but not high-risk myelodysplastic syndrome was able to rescue impaired erythroid and myeloid colony formation of early hematopoietic progenitors. In conclusion, our analyses support the notion that the stromal microenvironment is involved in the pathophysiology of myelodysplastic syndrome thus representing a potential target for therapeutic interventions.


Figures

Figure 1.
Figure 1.
MSC originated from MDS patients and healthy donors possess clonality and have different characteristics. (A) MSC are characterized by increased frequency of cells with a dysplastic appearance (lower panel, Giemsa staining 10× magnification, insets showing a cell in detail) and produce disorganized stromal layers (upper panel, 10× magnification). (B) MSC are able to generate fibroblastic colonies across two passages (P, and SubP) in all studied groups. (C) MSC can produce single cell derived (SCD) colonies; these colonies retain self-renewal and clonogenic potential (SubP-SCD). (D) MSC derived by plastic adherence and by SCD plating have distinct degrees of osteogenic and adipogenic potential, as seen by van Kossa staining (first 2 rows, 20× magnification) and by oil red staining (second 2 rows, 20× magnification). Results are expressed as mean ± SEM of independent cases, for (B) numbers were Healthy=6, LR-5q=6, LR=6 and HR=5; for (C) n=4 for all groups and n=3 for SubP. Significance was set as *P≤0.05; **P≤0.005; ***P≤0.001.
Figure 2.
Figure 2.
Proliferation of MDS-MSC is impaired. (A) Proliferation curves for each group were determined by seeding 5×10⁴ cells and measuring cell number at days 2, 4, 6, 8, and 14. (B) Apoptosis of MSC after 14 days of culture was determined by annexin V staining. (C) Senescence of MSC was demonstrated by β-galactosidase (β-gal) staining after 48 h of culture of 1×10³ cells per donor. Results are expressed as mean ± SEM of independent cases. For (A) numbers were Healthy=6, LR-5q=6, LR=6 and HR=5; for (B) Healthy n=6, LR-5q n=9, LR n=3 and HR n=3; (C) all groups n=4. Significance was set as */P≤0.05; **/††/‡‡P≤0.005; ***P≤0.001.
Figure 3.
Figure 3.
MSC provision of hematopoietic niche cytokines is altered in MDS. (A) RT-PCR with ABL-1 as reference gene and RNA extracted from MSC cultured for 14 days was used to determine the relative gene expression of SDF-1α, ANG1 and SCF. (B) ANG-1 concentration in MSC-supernatant (SN) was measured with an ELISA. (C) SDF-1α secretion by MSC with and without LEN treatment was measured with an ELISA on MSC-SN after 7 days of culture (C1) or 7 days culture + wash + 72 h of further culture without drug (C2). (D) The previously shown defect of SDF-1α secretion was functionally coupled to reduced migration of CD34+ healthy cells towards MSC-SN collected 72 h after washing and culture without drug; to show dependence of the effect on the SDF-1α/CXCR4 axis, AMD300 (CXCR4 inhibitor) was used at a concentration of 10 μM. Results are expressed as mean ± SEM of fold expression compared to controls which were set to 1 of independent cases. For (A) the numbers were Healthy=3, LR-5q=4, LR=4 and HR=4 for SDF-1 α and n=3 for all groups for SCF and ANG1; for (B) n=4 for all groups; for (C) the numbers were Healthy=6, LR-5q=6, LR=5 and HR=5 in (C1) and Healthy=4, LR-5q=4, LR=3 and HR=4 in (C2); for (D) n=3 for all groups. ΩIndicates difference between healthy and MDS groups without treatment. Significance was set as */ΩP≤0.05; **/Ω ΩP≤0.005; ***/Ω Ω ΩP≤0.001.
Figure 4.
Figure 4.
Hematopoietic support by MDS-MSC is impaired and affected by LEN treatment. CAF-C numbers were determined after seeding 1×10³ CD34+ healthy cells on MSC layers with or without LEN conditioning and co-culture for 28 days. Results are expressed as mean ± SEM of independent cases. Numbers were Healthy=6, LR-5q=6, LR=5 and HR=5. ΩIndicates difference between healthy and MDS groups without treatment. Significance was set as *P≤0.05; **/ΩΩP≤0.005; ***/ΩΩΩP≤0.001.
Figure 5.
Figure 5.
Support of expansion of healthy clonogenic progenitors by MDS-MSC is defective and modified by LEN. MSC were seeded on 35 mm plates and used for co-culture with 1×10³ healthy CD34+ cells using semi-solid media. After 14 days of co-culture, hematopoietic colony output was determined under an inverted microscope; the figure shows differences of colony type and numbers of each studied group and compares them to the baseline CFU-GEMM potential of the HSPC on an assay without stroma present. Results are expressed as mean ± SEM of independent cases. Numbers were HSPC alone n=3, Healthy n=5, LR-5q n=6, LR n=5 and HR n=5. Significance was set as * P≤0.05; **P≤0.005; *** P≤0.001.
Figure 6.
Figure 6.
MSC from MDS patients induce different apoptotic and proliferative responses on healthy HSPC and KG1-α leukemic cells. (A) Proliferation of CD34+ healthy cells and KG1-α cells was determined using CFSE staining and co-culture with stroma with or without addition of 100 nM of TNF-α measuring the dilution of the dye after 72 h by flow cytometry. The histograms show the percentage of cells that diluted CFSE beyond the level at day 0 of representative examples in the non-adherent fraction after co-culture with TNF-α (results were similar in all fractions regardless of cytokine presence). (B) Effect on apoptosis after co-culture with stroma was only evident in KG1-α cells and in the fraction of cells that after 24 h were not attached to the MSC layers; the percentage of annex-in+ cells is shown for both HSPC and KG1-α in the non-adherent fraction (apoptosis was similarly low to that of cells without co-culture in all fractions with HSPC and in the adherent fraction of KG1-α). Ω indicates differences between cells alone with TNF-α and cells co-cultured with stroma. Results are expressed as mean ± SEM of independent cases. For (A) numbers were Healthy=6, LR-5q=6, LR=5 and HR=5; for (B)n=3 for HSPC experiments and n=4 for KG1-α for all groups. Significance was set as */‡/ΩP≤0.05; **/††/ΩΩP≤0.005; †††/‡‡‡P≤0.001.

References

    1. Vardiman J. The classification of MDS: from FAB to WHO and beyond. Leuk Res. 2012;36(12):1453–8 - PubMed
    1. Nimer SD. Myelodysplastic syndromes. Blood. 2008;111(10):4841–51 - PubMed
    1. Bejar R, Levine R, Ebert BL. Unraveling the molecular pathophysiology of myelodysplastic syndromes. J Clin Oncol. 2011;29(5):504–15 - PMC - PubMed
    1. List A, Dewald G, Bennett J, Giagounidis A, Raza A, Feldman E, et al. Myelodysplastic Syndrome-003 Study Investigators Lenalidomide in the myelodysplastic syndrome with chromosome 5q deletion. N Engl J Med. 2006;355(14):1456–65 - PubMed
    1. Raza A, Reeves JA, Feldman EJ, Dewald GW, Bennet JM, Deeg HJ, et al. Phase 2 study of lenalidomide in transfusion-dependent, low-risk, and intermediate-1 risk myelodysplastic syndromes with karyotypes other than deletion 5q. Blood. 2008;111(1):86–93 - PubMed

Publication types