. 2013 Aug;33(15):2976-87.
doi: 10.1128/MCB.00074-13. Epub 2013 May 28.

Generation of mice deficient in both KLF3/BKLF and KLF8 reveals a genetic interaction and a role for these factors in embryonic globin gene silencing

Affiliations

Generation of mice deficient in both KLF3/BKLF and KLF8 reveals a genetic interaction and a role for these factors in embryonic globin gene silencing

Alister P W Funnell et al. Mol Cell Biol. 2013 Aug.

Abstract

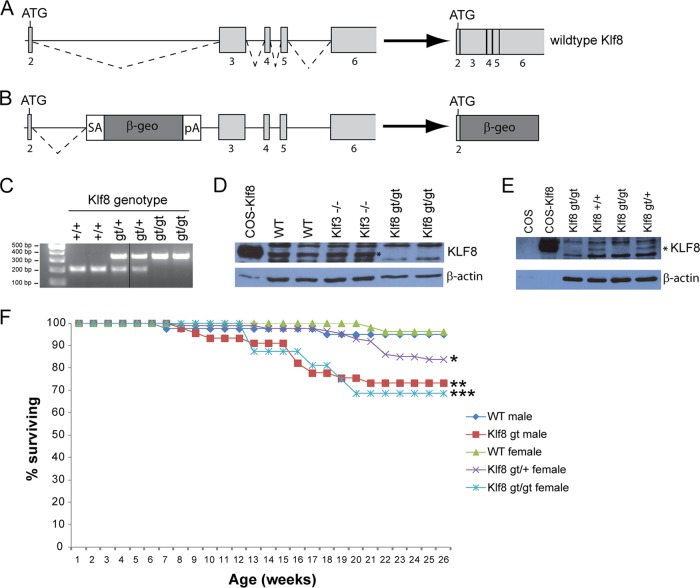
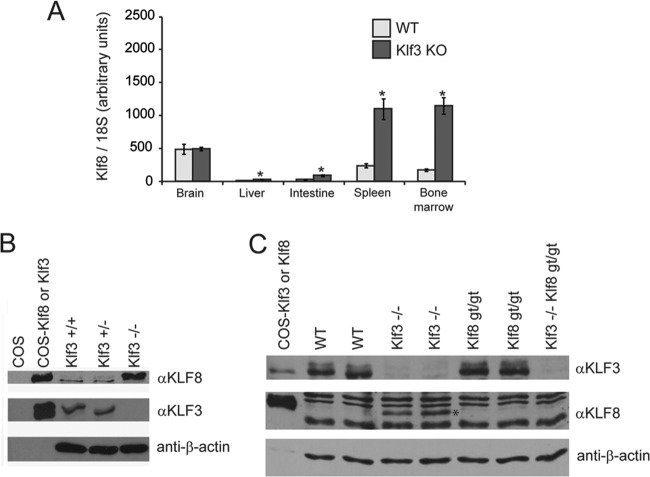
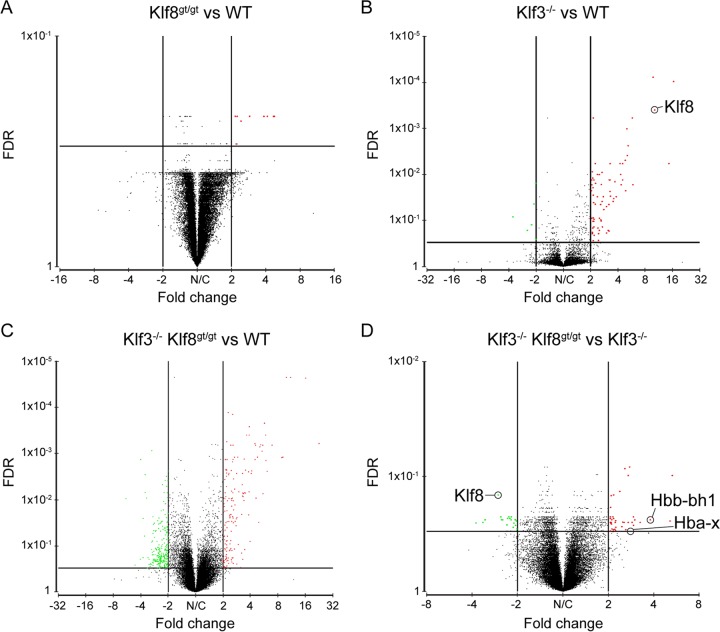
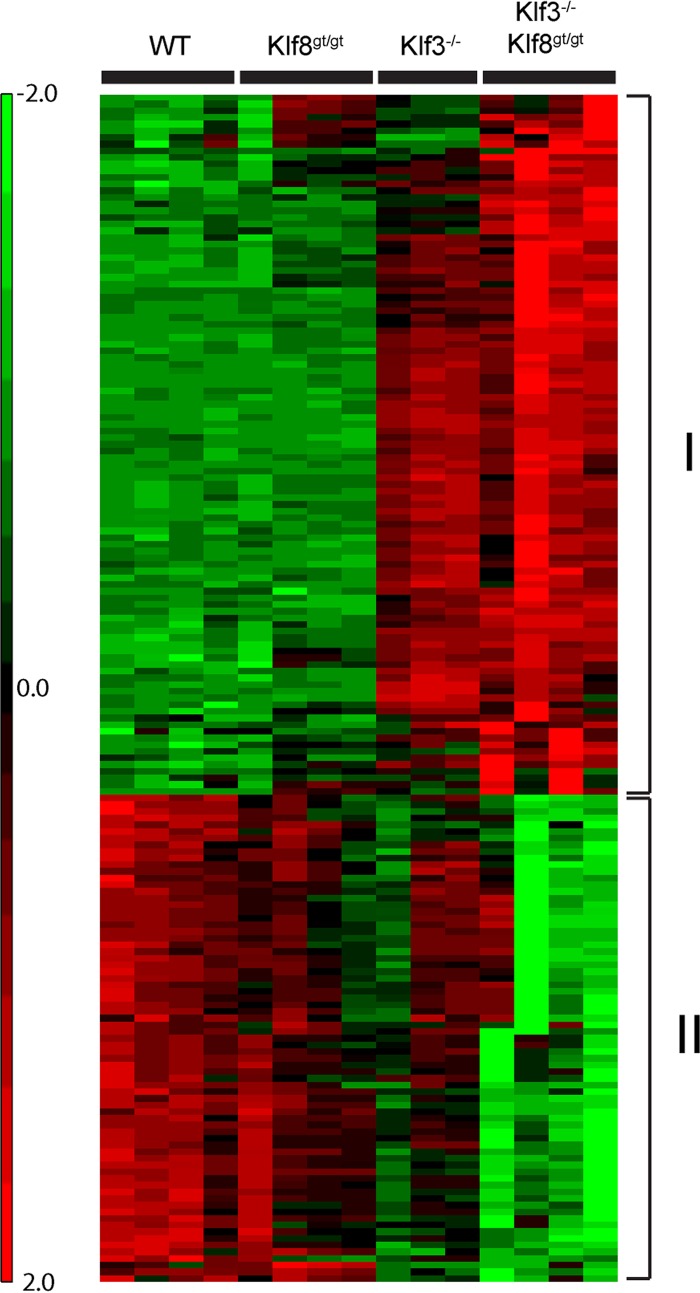
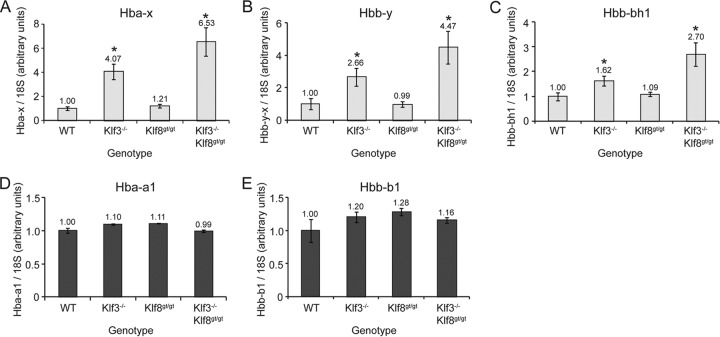
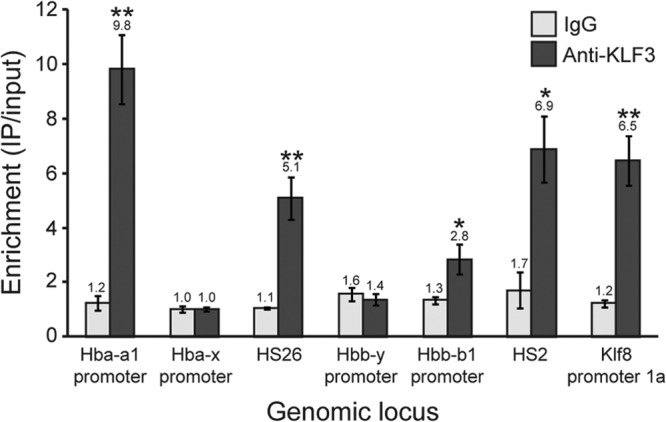
Krüppel-like factors 3 and 8 (KLF3 and KLF8) are highly related transcriptional regulators that bind to similar sequences of DNA. We have previously shown that in erythroid cells there is a regulatory hierarchy within the KLF family, whereby KLF1 drives the expression of both the Klf3 and Klf8 genes and KLF3 in turn represses Klf8 expression. While the erythroid roles of KLF1 and KLF3 have been explored, the contribution of KLF8 to this regulatory network has been unknown. To investigate this, we have generated a mouse model with disrupted KLF8 expression. While these mice are viable, albeit with a reduced life span, mice lacking both KLF3 and KLF8 die at around embryonic day 14.5 (E14.5), indicative of a genetic interaction between these two factors. In the fetal liver, Klf3 Klf8 double mutant embryos exhibit greater dysregulation of gene expression than either of the two single mutants. In particular, we observe derepression of embryonic, but not adult, globin expression. Taken together, these results suggest that KLF3 and KLF8 have overlapping roles in vivo and participate in the silencing of embryonic globin expression during development.


Figures

Fig 1
Fig 1
The Klf8 gene trap disrupts normal KLF8 expression and results in increased mortality. (A and B) Schematic of the wild-type (WT) murine Klf8 locus (A) and the location of the β-geo gene trap (B). Klf8 exons are shown as lightly shaded boxes. The gene trap contains a splice acceptor (SA) site, a β-galactosidase–Neomycin resistance fusion gene (β-geo), and a poly(A) signal. The β-geo fusion protein contains a short (24-amino-acid) N-terminal portion encoded by exon 2 of Klf8. (C) Multiplex genotyping PCRs confirming the integration site of the gene trap in the Klf8 locus. Primer pairs were used that flank the site of gene trap insertion (210-bp product for a wild-type, intact allele) and that recognize the gene trap (348-bp product). (D) Western blot of KLF8 expression (top panel) in the fetal brain (E14.5) for the genotypes indicated. KLF8 expressed in COS cells has been included as a positive control, while β-actin levels are shown as loading controls (bottom panel). (E) Western blots of KLF8 (top panel) and β-actin (bottom panel) in E10.5 placenta. In panels D and E, the band corresponding to KLF8 is marked with an asterisk. (F) Percentage of animals surviving for the genotypes indicated over a 6-month period. n = 40 wild-type males, n = 45 Klf8gt males, n = 52 wild-type females, n = 87 Klf8gt/+ females, and n = 16 Klf8gt/gt females. * and ***, P < 0.05 and P < 0.001, respectively, compared to wild-type females; **, P < 0.01 compared to wild-type males (log rank tests).
Fig 2
Fig 2
Klf8 expression is elevated in erythroid tissue in the absence of KLF3. (A) Klf8 transcript levels were quantified by real-time RT-PCR in whole tissues from adult wild-type (WT; n = 3) and Klf3−/− (Klf3 KO; n = 3) mice. Expression has been normalized to 18S rRNA levels, and the lowest level (wild-type liver) has been set to 1.0. Error bars represent standard errors of the mean. *, P < 0.04 (two-tailed t test for Klf3−/− compared to wild type). (B and C) Western blots of E14.5 (B) and E13.5 (C) fetal liver nuclear extracts using anti-KLF8 (αKLF8), anti-KLF3 (αKLF3), and anti-β-actin sera. Genotypes are indicated, and nuclear extracts from COS cells (mock transfected or overexpressing KLF3 or KLF8) have been included as controls. In panel C, the band corresponding to KLF8 is marked with an asterisk.
Fig 3
Fig 3
Volcano plots demonstrating gene expression changes in Klf8gt/gt, Klf3−/−, and Klf3−/− Klf8gt/gt Ter119+ E13.5 fetal liver cells. (A) Klf8gt/gt versus wild type (WT). (B) Klf3−/− versus WT. (C) Klf3−/− Klf8gt/gt versus WT. (D) Klf3−/− Klf8gt/gt versus Klf3−/−. Significance thresholds are shown (>2-fold deregulation, FDR < 0.3), and significantly deregulated genes are represented by red dots (derepressed relative to WT [A to C] or Klf3−/− [D]) or green dots (downregulated relative to WT [A to C] or Klf3−/− [D]).
Fig 4
Fig 4
Heat map showing the relative expression of the genes that are deregulated in Klf3−/− Klf8gt/gt Ter119+ E13.5 fetal liver cells compared to the wild type (WT). Genes that are significantly upregulated (group I) and downregulated (group II) in Klf3−/− Klf8gt/gt cells are represented, and their relative expression across the four genotypes (wild type, Klf8gt/gt, Klf3−/−, and Klf3−/− Klf8gt/gt) is shown.
Fig 5
Fig 5
Embryonic, but not adult, globin genes are derepressed in Klf3−/− and Klf3−/− Klf8gt/gt Ter119+ E13.5 fetal liver cells. Transcript levels for Hba-x (A), Hbb-y (B), Hbb-bh1 (C), Hba-a1 (D), and Hbb-b1 (E) were determined by qRT-PCR analysis of total RNA from three wild-type (WT), five Klf3−/−, seven Klf8gt/gt, and four Klf3−/− Klf8gt/gt embryos. Embryonic globin genes are shown in light gray, and adult globin genes are in dark gray. Expression has been normalized to 18S rRNA levels, and wild-type samples have been set to 1.0 for each gene. Error bars indicate standard errors of the mean. *, P ≤ 0.05 (two-tailed t test compared to wild type).
Fig 6
Fig 6
Chromatin immunoprecipitation analysis of KLF3 occupancy at α- and β-globin loci in induced MEL cells. ChIP assays were conducted in triplicate, and enrichment has been determined by quantitative real-time PCR and has been normalized to input. The lowest values for both IgG and anti-KLF3 have been set to 1.0. Klf8 promoter 1a has been included as a positive control. Error bars represent standard errors of the mean. *, P < 0.05; **, P < 0.005 (one-tailed t test compared to IgG). HS, DNase-hypersensitive site.

References

    1. Pearson R, Fleetwood J, Eaton S, Crossley M, Bao S. 2008. Kruppel-like transcription factors: a functional family. Int. J. Biochem. Cell Biol. 40:1996–2001 - PubMed
    1. McConnell BB, Yang VW. 2010. Mammalian Kruppel-like factors in health and diseases. Physiol. Rev. 90:1337–1381 - PMC - PubMed
    1. Feng WC, Southwood CM, Bieker JJ. 1994. Analyses of beta-thalassemia mutant DNA interactions with erythroid Kruppel-like factor (EKLF), an erythroid cell-specific transcription factor. J. Biol. Chem. 269:1493–1500 - PubMed
    1. Klevit RE. 1991. Recognition of DNA by Cys2,His2 zinc fingers. Science 253:1367–1393 - PubMed
    1. Shields JM, Yang VW. 1998. Identification of the DNA sequence that interacts with the gut-enriched Kruppel-like factor. Nucleic Acids Res. 26:796–802 - PMC - PubMed

Publication types