. 2013 Jul 2;54(7):4459-70.
doi: 10.1167/iovs.12-11116.

Staging of macular telangiectasia: power-Doppler optical coherence tomography and macular pigment optical density

Affiliations

Staging of macular telangiectasia: power-Doppler optical coherence tomography and macular pigment optical density

Eric K Chin et al. Invest Ophthalmol Vis Sci. .

Abstract

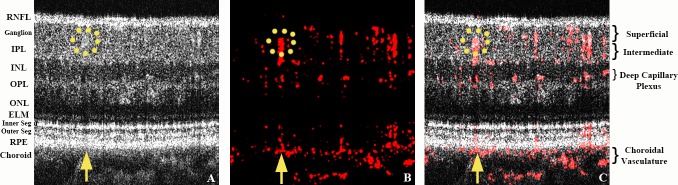
Purpose: Two methods were used to study the stages of macular telangiectasia (MACTEL): Power-Doppler optical coherence tomography (PD-OCT), which allows imaging of the retinal circulation in three dimensions, and macular pigment optical density (MPOD), which quantifies the distribution of macular carotenoids.

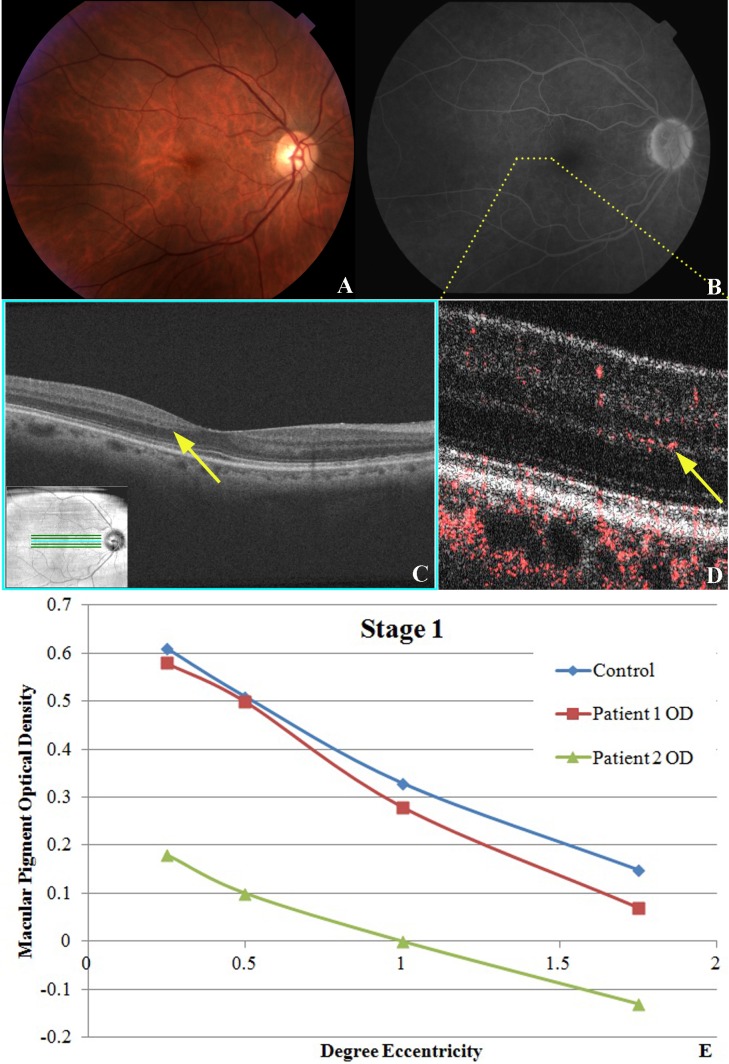
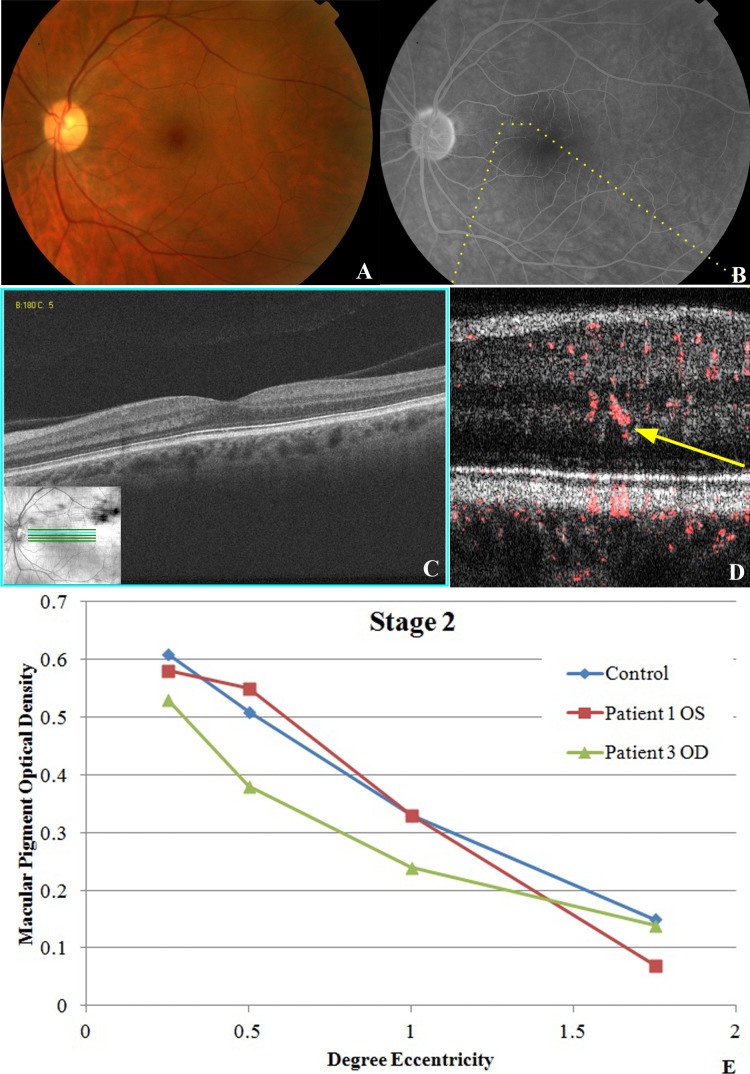
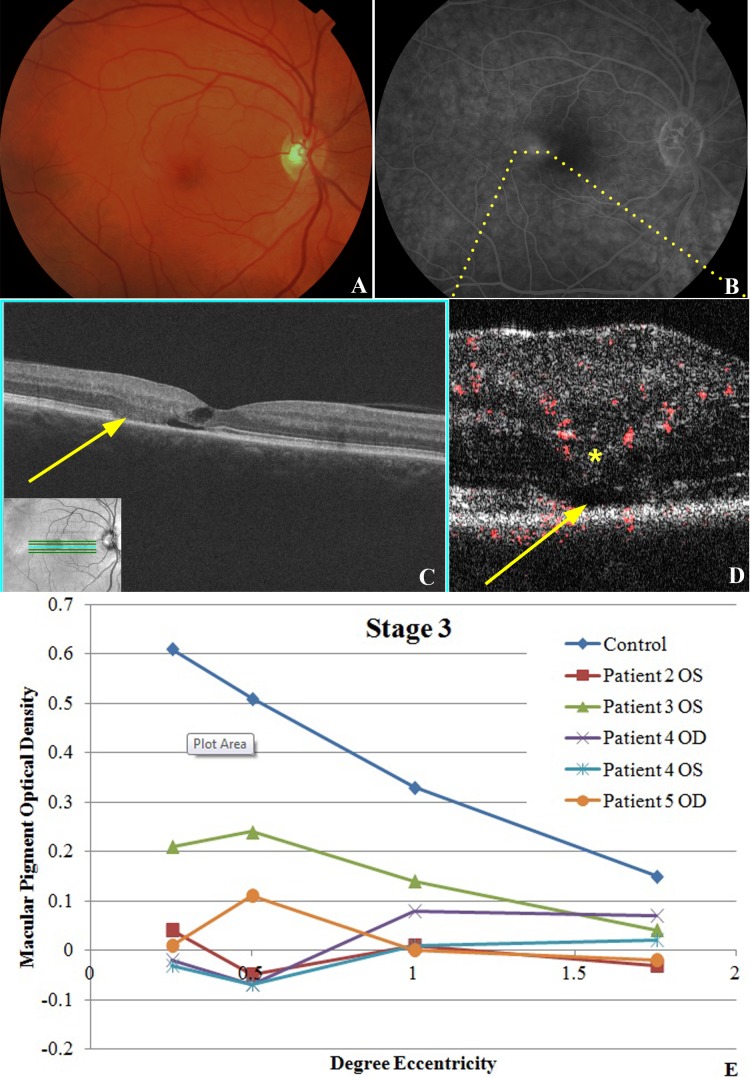
Methods: Among 49 patients with MacTel identified, 12 eyes (6 patients) with MacTel and 7 age-matched control eyes (7 patients) were imaged with a custom-built Fourier-domain OCT instrument to acquire PD-OCT images. MPOD was measured using heterochromatic flicker photometry in 10 eyes (5 patients) with MacTel and compared with 44 age-matched control eyes (44 patients). Clinical staging of MacTel was based on best-corrected visual acuity, fundus biomicroscopy, fluorescein angiography, and OCT.

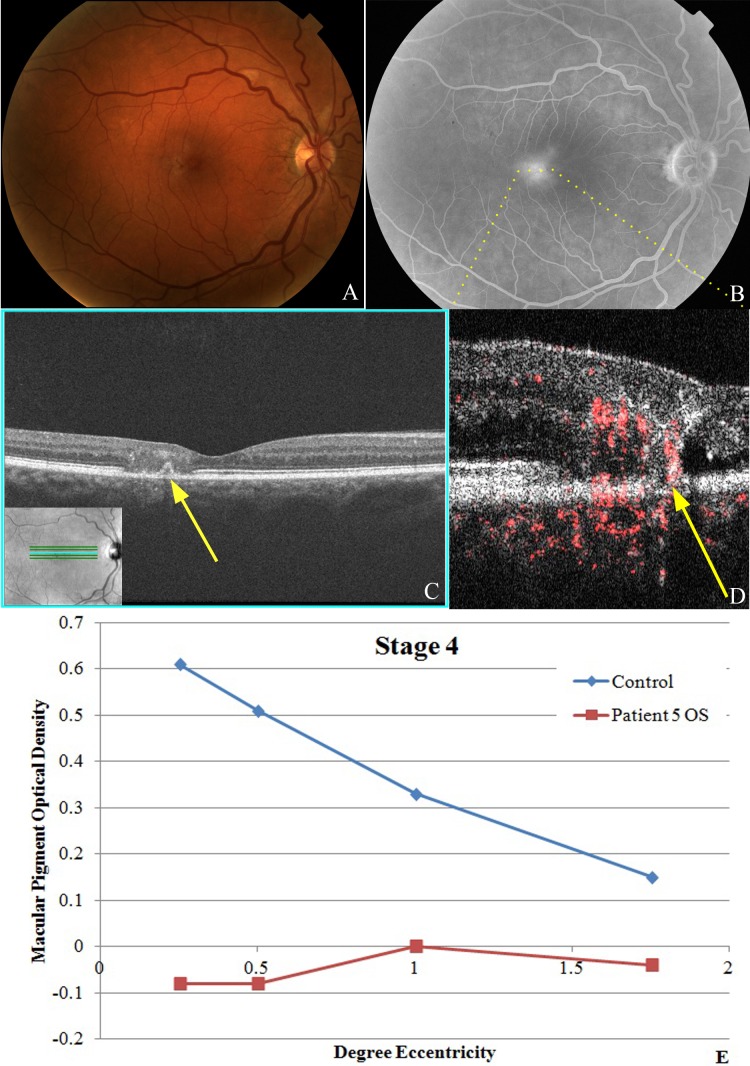
Results: Stage 1 eyes (n = 2) had subtle punctate vascular signal confined to the inner portion of the outer plexiform layer (OPL) on PD-OCT. Stage 2 (n = 2) showed larger oblique vascular signal extending into deeper OPL. Stage 3 (n = 5) had disruption of outer retinal layers with abnormal vasculature extending into the outer nuclear layer. Stage 4 (n = 3) showed diffuse blurring of the retinal layers with vascular channels extending the full thickness of the retina. MPOD values in four eyes with stage 1 or 2 MacTel correlated well with age-matched controls. Six eyes with stage 3 or 4 MacTel had loss of MPOD especially at the fovea.

Conclusions: PD-OCT shows penetration of the retinal capillaries into the deeper retinal layers in early stages of MacTel, with full thickness vascular proliferation in advanced disease. MPOD is commonly depleted but may appear normal in early stage MacTel.

Keywords: Power-Doppler; heterochromatic flicker photometry; idiopathic macular telangiectasia; macular pigment; optical coherence tomography; retinal telangiectasia.


Figures

Figure 1
Figure 1
Power-Doppler OCT image acquisition of a normal macula. The yellow upward arrow points to a representative normal shadow artifact resulting from a larger superficial vessel highlighted with a yellow dotted circle. Most of the radial-oriented signals in this image represent shadow artifacts. They can be differentiated from true vascular signals by scanning the serial B-scans to determine whether they follow the course of the overlying vessel. (A) OCT reflectivity BM-scan image obtained from the average of three B-scans showing the various layers of the retina. (B) Calculated Power-Doppler values from an averaged BM-scan (red denotes the phase signal; i.e., retinal blood flow); (C) final composite image of first two images (A, B) superimposed over each other.
Figure 2
Figure 2
Stage 1 MacTel disease. (A) Fundus photography of right eye of patient No. 2 is unremarkable except for some hard macular drusen with faint graying or hypopigmentation just temporal to the fovea. (B) Late view fluorescein angiography showing barely visible punctate hyperfluorescence and fine telangiectatic vessels temporal to the foveal avascular zone. (C) Fd-OCT showing subtle focal outer layer hyporeflective irregularities (yellow arrow) between the outer plexiform layer and outer nuclear layer temporal to the fovea. (D) PD-OCT image through the temporal perifoveal zone denoted by yellow dotted line in (B) showing retinal blood flow originating at the outer plexiform layer and diving abnormally deep into the outer nuclear layer (yellow arrow). (E) MPOD levels at various levels of eccentricity compared with age-matched controls show a similar slope.
Figure 3
Figure 3
Stage 2 MacTel disease. (A) Fundus photography of the left eye of patient No. 1 is unremarkable except for possible trace hypopigmentation of the superior and temporal perifoveal region and a right-angle venule temporal to the fovea. (B) Late view of fluorescein angiography showing trace leakage with mild telangiectatic vessels in superior and temporal perifoveal region. (C) Fd-OCT shows no intraretinal cysts or photoreceptor layer abnormalities. (D) PD-OCT B-scan image of the superonasal perifoveal region (yellow dotted line in [B] demonstrates the higher caliber vascular flow in the outer plexiform layer and diving deeper into the outer nuclear layer. (E) MPOD levels at various levels of eccentricity compared with age-matched controls showing normal macular pigment relative to age-matched controls for both tested eyes in this stage of MacTel.
Figure 4
Figure 4
Stage 3 MacTel disease. (A) Fundus photography of right eye of patient No. 5 shows a mildly blunted foveal reflex with right-angle venule temporal to fovea. There is some loss of the macular pigment temporally. (B) Late view of fluorescein angiography shows prominent leakage temporal to the fovea associated with fine telangiectatic vessels. (C) Fd-OCT shows photoreceptor loss temporal to the fovea (yellow arrow), with fine cystic changes within the retina. (D) PD-OCT B-scan image shows intraretinal vascular signal within the outer plexiform layer (yellow asterisk), which appears to dive into the deeper outer nuclear layer in regions of disruption of photoreceptor IS/OS junction (yellow arrow). (E) MPOD levels at various levels of eccentricity compared with age-matched controls show decreased MPOD for all eyes and eccentricities tested in this stage of MacTel. The decrease is most pronounced centrally.
Figure 5
Figure 5
Stage 4 MacTel disease. (A) Fundus photography of the right eye of patient No. 6 shows graying and depigmentation of the temporal perifoveal region with a small dark pigmented plaque. (B) Late view of fluorescein angiography showing prominent leakage temporal to the fovea. (C) Fd-OCT showing patch of diffuse disruption of the retinal layers with a possible small pigment epithelial detachment (yellow arrow). (D) PD-OCT B-scan image of the temporal perifoveal region depicted by dotted yellow line in (B) showing apparent vascular signals extending the entire thickness of the retina and connecting the inner and outer retinal layers, adjacent to outer retinal cysts and photoreceptor atrophy, with possible anastomoses into the subretinal/choroidal space. (E) MPOD levels at various levels of eccentricity compared with age-matched controls show reduced levels throughout.

References

    1. Charbel Issa P, Holz FG, Scholl HPN Findings in fluorescein angiography and optical coherence tomography after intravitreal bevacizumab in type 2 idiopathic macular telangiectasia. Ophthalmology. 2007; 114: 1736–1742 - PubMed
    1. Gass JD, Blodi BA. Idiopathic juxtafoveolar retinal telangiectasis. Update of classification and follow-up study. Ophthalmology. 1993; 100: 1536–1546 - PubMed
    1. Yannuzzi LA, Bardal AM, Freund KB, et al. Idiopathic macular telangiectasia. Arch Ophthalmol. 2006; 124; 450–460 - PubMed
    1. Gass JD, Oyakawa RT. Idiopathic juxtafoveolar retinal telangiectasis. Arch Ophthalmol. 1982; 100: 769–780 - PubMed
    1. Yannuzzi LA. The Retinal Atlas. Oxford, UK: Saunders Elsevier; 2010: 422–429

Publication types

Substances