. 2013 Jun 21;54(6):4287-95.
doi: 10.1167/iovs.12-11388.

Regional correlation among ganglion cell complex, nerve fiber layer, and visual field loss in glaucoma

Affiliations

Regional correlation among ganglion cell complex, nerve fiber layer, and visual field loss in glaucoma

Phuc V Le et al. Invest Ophthalmol Vis Sci. .

Abstract

Purpose: To analyze the relationship among macular ganglion cell complex (GCC) thickness, peripapillary nerve fiber layer (NFL) thickness, and visual field (VF) defects in patients with glaucoma.

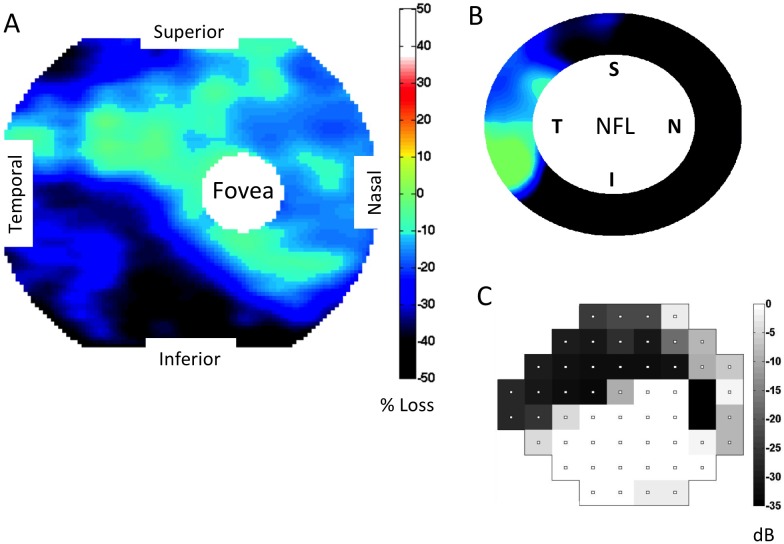
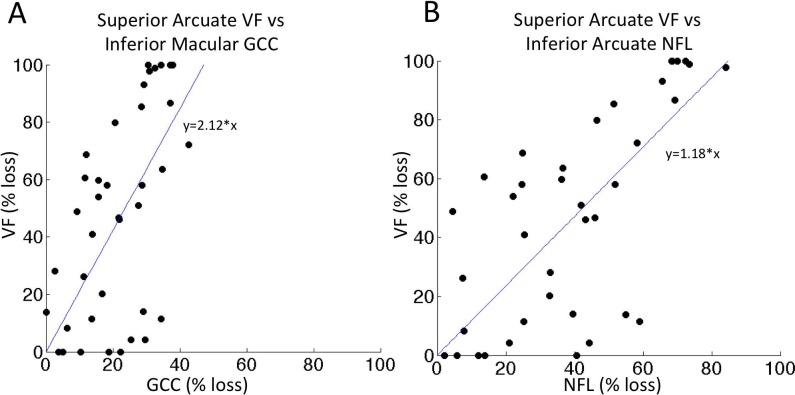
Methods: A Fourier-domain optical coherence tomography (FD-OCT) system was used to map the macula and peripapillary regions of the retina in 56 eyes of 38 patients with perimetric glaucoma. The macular GCC and peripapillary NFL thicknesses were mapped and standard automated perimetry (SAP) was performed. Loss of GCC and NFL were correlated with the VF map on both a point-by-point and regional basis.

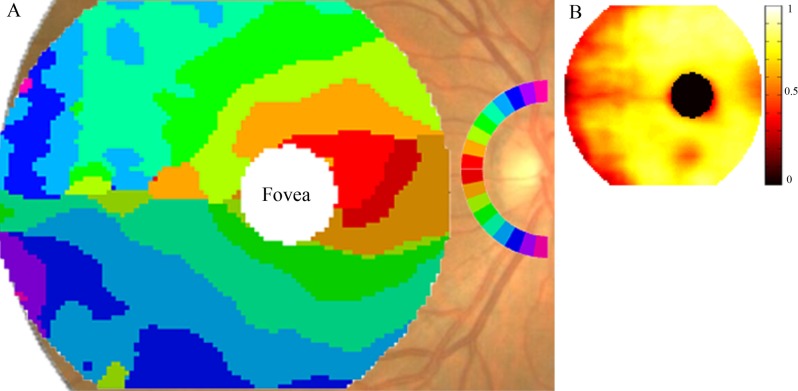
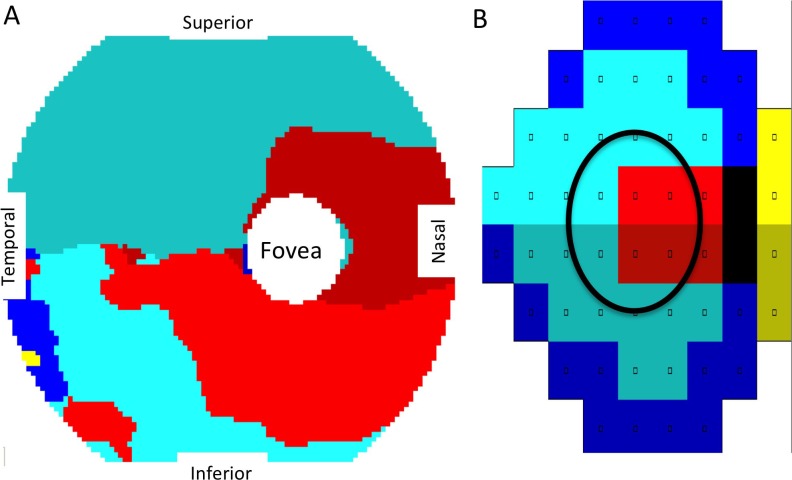
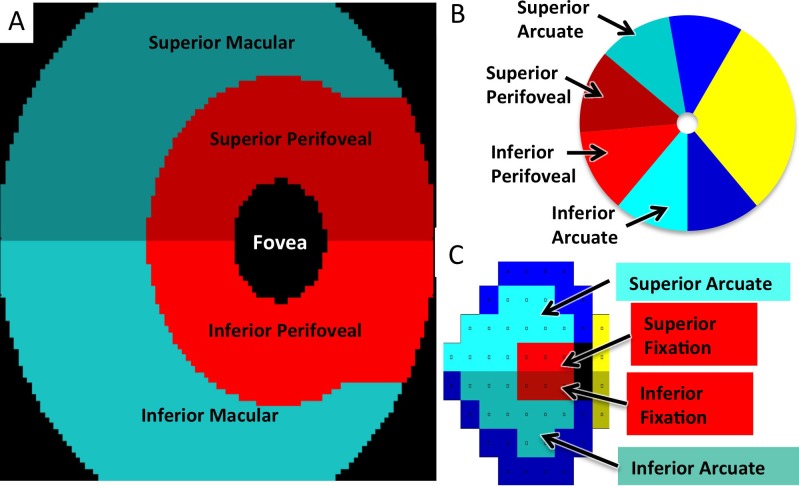
Results: Correlation between GCC thickness and peripapillary NFL thickness produced a detailed correspondence map that demonstrates the arcuate course of the NFL in the macula. Corresponding regions within the GCC, NFL, and VF maps demonstrate significant correlation, once parafoveal retinal ganglion cell (RGC) displacement is taken into account.

Conclusions: There are significant point-specific and regional correlations between GCC loss, NFL loss, and deficits on SAP. Using these different data sources together may improve our understanding of glaucomatous damage and aid in the management of patients with glaucoma.

Keywords: ganglion cell complex; optical coherence tomography; retinal nerve fiber layer; visual field.


Figures

Figure 1
Figure 1
GCC, NFL, and VF maps in an eye with predominantly superior field defect. (A) Macular GCC thickness map, expressed as percent loss. (B) Peripapillary NFL thickness map, also expressed as percent loss. Same color scale as in (A). (C) The Humphrey 24-2 VF TD, displayed graphically. This eye has a large area of inferior ganglion cell complex (GCC) thinning encroaching on the fovea. There is corresponding peripapillary NFL loss inferiorly and a dense superior arcuate defect affecting fixation. NFL, nerve fiber layer; VF, visual field.
Figure 2
Figure 2
Map of correspondence between macular GCC loss and peripapillary NFL loss. (A) GCC map colored according to the highest correlating 10° angular sector of the peripapillary NFL. The inferior half of the peripapillary NFL is colored symmetrically to the superior half, but darker to allow differentiation between the two. (B) Pearson correlation coefficient R-value (ranges from 0 to 1) at each corresponding position of the GCC map in (A). The values range from 0.3 to 0.87.
Figure 3
Figure 3
Map of correspondence between macular GCC loss and VF deficit. (A) The GCC map colored according to the highest correlating position in the Humphrey 24-2 VF shown in (B). (B) Humphrey 24-2 VF grouped according to the work of Garway-Heath et al. The area circled in the VF roughly corresponds to the macular GCC scan area.
Figure 4
Figure 4
Macular GCC, VF, and NFL regions for correlation analysis. (A) The GCC map divided into superior and inferior perifoveal and macular regions for correlation analysis, taking parafoveal ganglion cell displacement into account. Colors represent anatomically related regions. (B) Peripapillary NFL divided into superior and inferior perifoveal and arcuate regions. The superior arcuate region extends from 100° to 140°. The superior perifoveal region extends from 140° to 185°. The inferior perifoveal region extends from 185° to 230°, and the inferior arcuate region extends from 230° to 270°. (C) Humphrey 24-2 VF divided into superior and inferior fixation and arcuate regions.
Figure 5
Figure 5
Scatterplot of VF versus GCC and VF versus NFL. Scatterplot and regression line for the region with the highest amount of damage in our dataset. (A) Superior arcuate VF versus inferior macular GCC; slope of the regression line Superior arcuate VF versus inferior arcuate NFL; slope of the regression line is 1.18. The regression lines were anchored at the origin.

References

    1. Sommer A, Katz J, Quigley HA, et al. Clinically detectable nerve fiber atrophy precedes the onset of glaucomatous field loss. Arch Ophthalmol. 1991; 109: 77–83 - PubMed
    1. Townsend KA, Wollstein G, Schuman JS. Imaging of the retinal nerve fibre layer for glaucoma. Br J Ophthalmol. 2009; 93: 139–143 - PMC - PubMed
    1. Lin SC, Singh K, Jampel HD, et al. Optic nerve head and retinal nerve fiber layer analysis: a report by the American Academy of Ophthalmology. Ophthalmology. 2007; 114: 1937–1949 - PMC - PubMed
    1. Vizzeri G, Kjaergaard SM, Rao HL, Zangwill LM. Role of imaging in glaucoma diagnosis and follow-up. Indian J Ophthalmol. 2011; 59: S59–S68 - PMC - PubMed
    1. Tan O, Chopra V, Lu AT, et al. Detection of macular ganglion cell loss in glaucoma by Fourier-domain optical coherence tomography. Ophthalmology. 2009; 116: 2305–2314.e1 –2 - PMC - PubMed

Publication types