. 2013 Aug;41(14):e140.
doi: 10.1093/nar/gkt444. Epub 2013 May 28.

Computational analysis of bacterial RNA-Seq data

Affiliations

Computational analysis of bacterial RNA-Seq data

Ryan McClure et al. Nucleic Acids Res. 2013 Aug.

Abstract

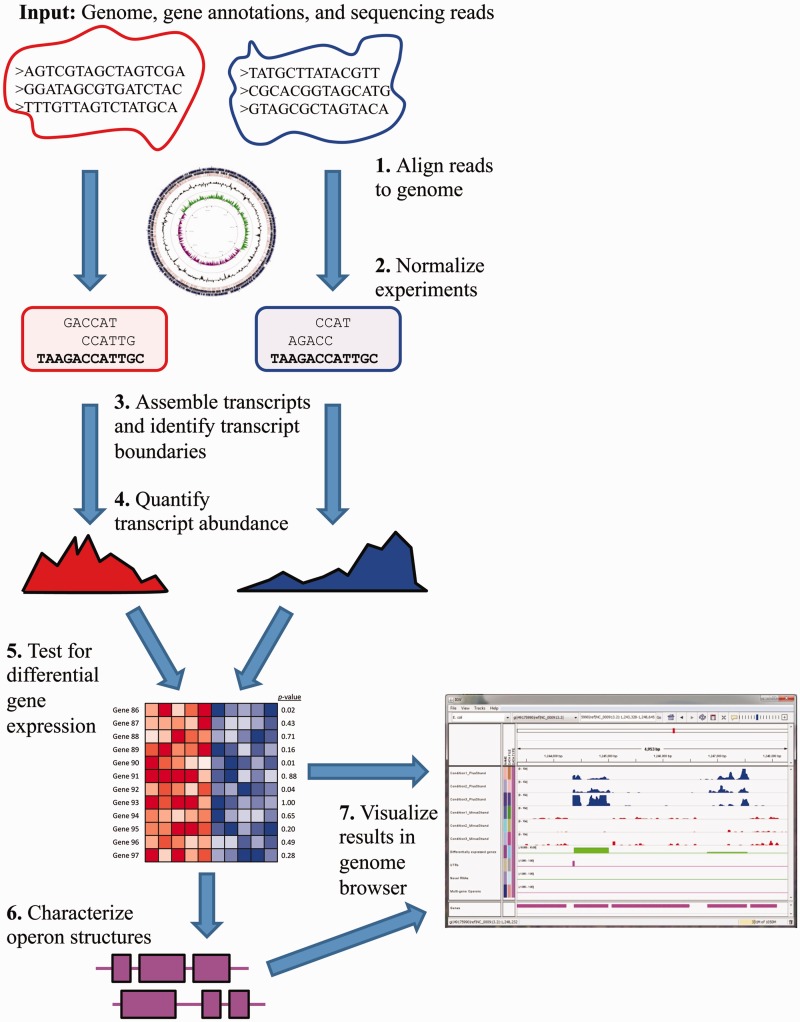
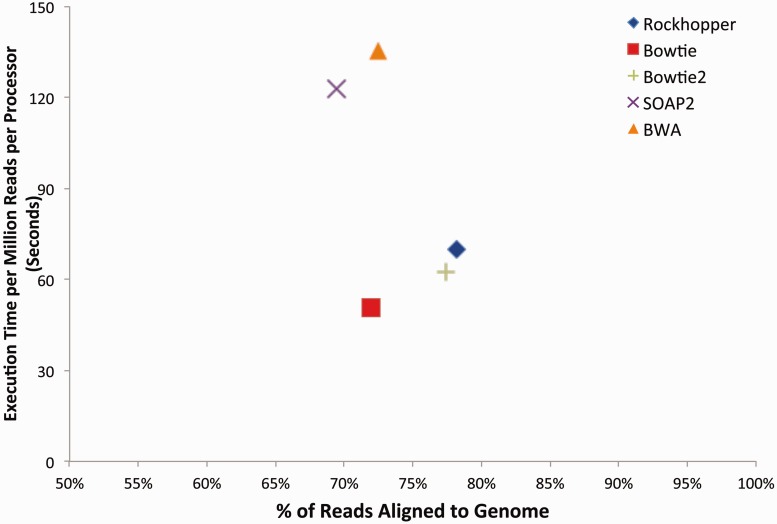
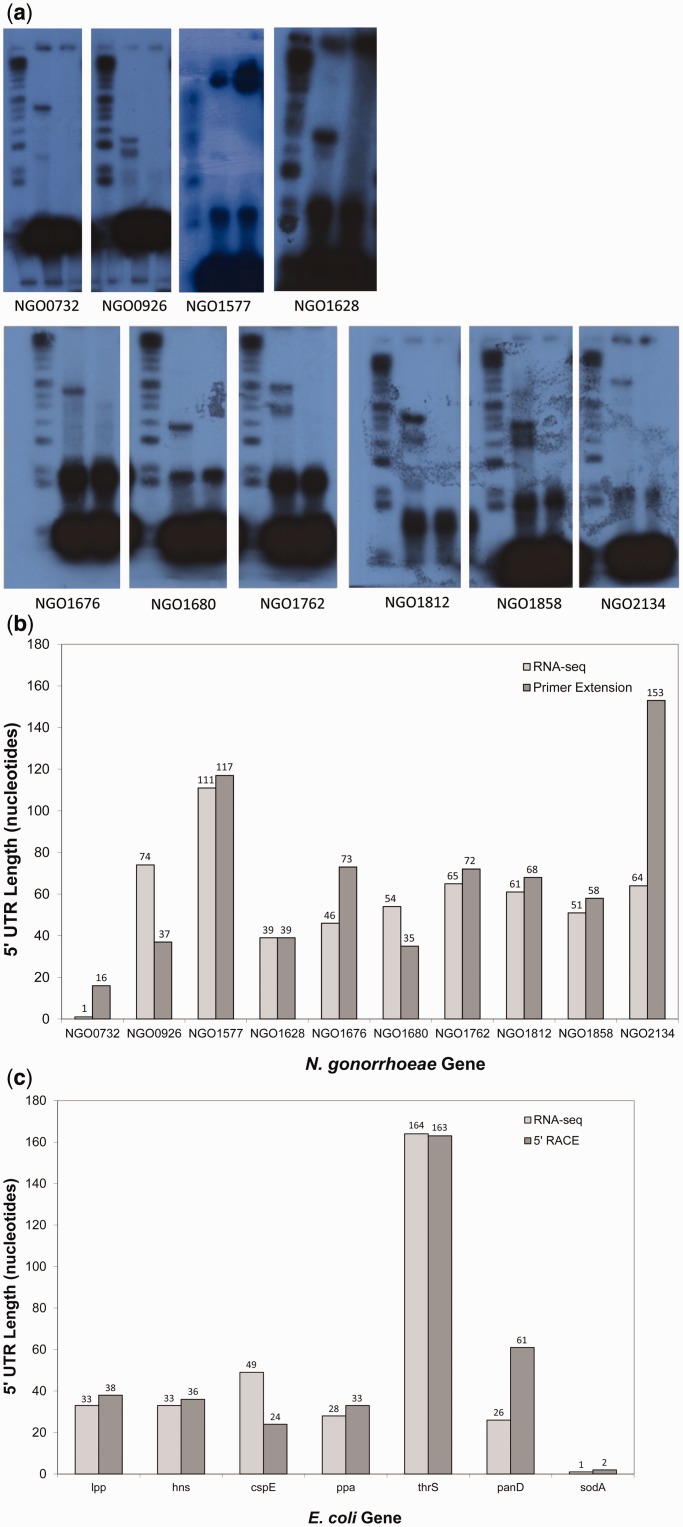
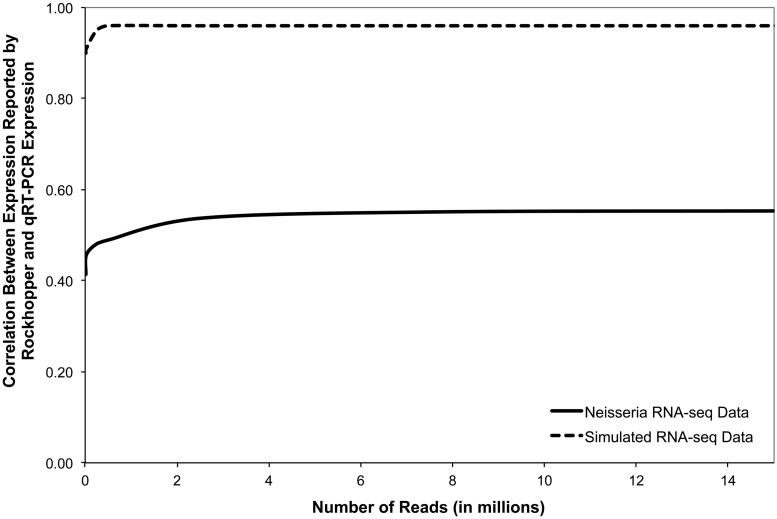
Recent advances in high-throughput RNA sequencing (RNA-seq) have enabled tremendous leaps forward in our understanding of bacterial transcriptomes. However, computational methods for analysis of bacterial transcriptome data have not kept pace with the large and growing data sets generated by RNA-seq technology. Here, we present new algorithms, specific to bacterial gene structures and transcriptomes, for analysis of RNA-seq data. The algorithms are implemented in an open source software system called Rockhopper that supports various stages of bacterial RNA-seq data analysis, including aligning sequencing reads to a genome, constructing transcriptome maps, quantifying transcript abundance, testing for differential gene expression, determining operon structures and visualizing results. We demonstrate the performance of Rockhopper using 2.1 billion sequenced reads from 75 RNA-seq experiments conducted with Escherichia coli, Neisseria gonorrhoeae, Salmonella enterica, Streptococcus pyogenes and Xenorhabdus nematophila. We find that the transcriptome maps generated by our algorithms are highly accurate when compared with focused experimental data from E. coli and N. gonorrhoeae, and we validate our system's ability to identify novel small RNAs, operons and transcription start sites. Our results suggest that Rockhopper can be used for efficient and accurate analysis of bacterial RNA-seq data, and that it can aid with elucidation of bacterial transcriptomes.


Figures

Figure 1.
Figure 1.
Rockhopper workflow. The input to Rockhopper consists of a genome sequence (FASTA file), gene annotations (PTT and RNT files) and sequencing reads (FASTQ or QSEQ or FASTA files). The different stages of Rockhopper’s workflow are illustrated. Rockhopper’s results are output as tab-delimited text files as well as visually using the Integrated Genomics Viewer.
Figure 2.
Figure 2.
Aligning sequencing reads to a genome. The performance of five tools for aligning reads to a genome is shown. The five tools are Rockhopper (version 1.00), Bowtie (version 0.12.7), Bowtie2 (version 2.0.0-beta5), SOAP2 (version 2.21) and BWA (version 0.6.2). Each tool is based on an FM-index, and each tool was executed on the same machine with default parameters using the same number of processors. The tools were evaluated by the percentage of 2 134 636 656 reads that they successfully aligned to a reference genome (x-axis) and by the execution time they required per million reads per processor (y-axis). The reads come from 75 RNA-seq experiments conducted using five different bacteria.
Figure 3.
Figure 3.
5′ UTR analysis. (a) Results from primer extension for 10 N. gonorrhoeae genes. Probes were designed to lay down 100 nucleotides upstream of the transcription start site identified by analysis of the RNA-seq data. Gene designations correspond to N. gonorrhoeae strain FA1090. (b) For 10 N. gonorrhoeae genes, the length of the 5′ UTR as determined from RNA-seq data is depicted (light gray) and the length of the 5′ UTR as determined from primer extension analysis is depicted (dark gray). Gene designations correspond to N. gonorrhoeae strain FA1090. (c) For seven E. coli genes, the length of the 5′ UTR as determined from RNA-seq data is depicted (light gray) and the length of the 5′ UTR as determined from 5′ RACE is depicted (dark gray).
Figure 4.
Figure 4.
Correlation between expression abundances determined by Rockhopper based on RNA-seq data and confirmed expression abundances. Correlation is computed based on expression abundances determined by Rockhopper when different sized random subsets of RNA-seq reads are used. The solid curve represents, for nine N. gonorrhoeae genes, the correlation between expression levels as determined by Rockhopper based on a RNA-seq experiment and as determined via qRT-PCR. The dashed curve represents, for 2002 N.gonorrhoeae genes, the correlation between expression levels as determined by Rockhopper based on a simulated RNA-seq experiment and as determined via simulation.
Figure 5.
Figure 5.
Relative expression of 10 E. coli genes from wild-type cells grown in LB medium with αMG as compared with expression of the same genes from cells grown in LB medium without αMG. Error bars in the figure are determined from three biological replicates. (a) Relative expression of the 10 genes as determined from qPCR. (b) Relative expression of the 10 genes as determined from RNA-seq.
Figure 6.
Figure 6.
RT-PCR results for pairs of genes predicted to be co-transcribed. Lanes 9 and 10 in the RT-PCR figure correspond to two different promoters for the rseP-bamA operon. The 27 assayed pairs of genes correspond to 10 predicted operons containing 13 pairs of genes that were previously shown to be co-transcribed and containing 14 pairs of genes not previously shown to be co-transcribed.
Figure 7.
Figure 7.
RT-PCR analysis of pairs of consecutive genes from N.gonorrhoeae F62 wild-type bacteria. RT-PCR was performed on total RNA by using primer pairs designed to span the entire region containing gene pairs. Below each lane, the gene pair is listed along with the size of the region containing the gene pair. (a) RT amplification products are evident for six gene pairs predicted to be co-transcribed by Rockhopper based on RNA-seq data. (b) RT amplification products are evident for one of two gene pairs predicted not to be co-transcribed by Rockhopper based on RNA-seq data.

References

    1. Wang Z, Gerstein M, Snyder M. RNA-Seq: a revolutionary tool for transcriptomes. Nat. Rev. Genet. 2009;10:57–63. - PMC - PubMed
    1. Croucher NJ, Thomson NR. Studying bacterial transcriptomes using RNA-seq. Curr. Opin. Microbiol. 2010;13:619–624. - PMC - PubMed
    1. Sorek R, Cossart P. Prokaryotic transcriptomics: a new view on regulation, physiology and pathogenicity. Nat. Rev. Genet. 2010;11:9–16. - PubMed
    1. Sittka A, Lucchini S, Papenfort K, Sharma CM, Rolle K, Binnewies TT, Hinton JC, Vogel J. Deep sequencing analysis of small noncoding RNA and mRNA targets of the global post-transcriptional regulator, Hfq. PLoS Genet. 2008;4:e1000163. - PMC - PubMed
    1. Liu JM, Livny J, Lawrence MS, Kimball MD, Waldor MK, Camilli A. Experimental discovery of sRNAs in Vibrio cholerae by direct cloning, 5S/tRNA depletion and parallel sequencing. Nucleic Acids Res. 2009;37:e46. - PMC - PubMed

Publication types