. 2013;9(5):e1003375.
doi: 10.1371/journal.ppat.1003375. Epub 2013 May 23.

Asexual populations of the human malaria parasite, Plasmodium falciparum, use a two-step genomic strategy to acquire accurate, beneficial DNA amplifications

Affiliations

Asexual populations of the human malaria parasite, Plasmodium falciparum, use a two-step genomic strategy to acquire accurate, beneficial DNA amplifications

Jennifer L Guler et al. PLoS Pathog. 2013.

Abstract

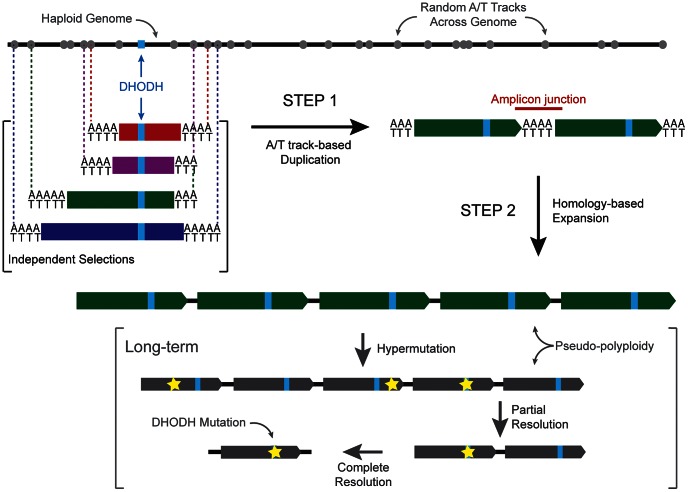
Malaria drug resistance contributes to up to a million annual deaths. Judicious deployment of new antimalarials and vaccines could benefit from an understanding of early molecular events that promote the evolution of parasites. Continuous in vitro challenge of Plasmodium falciparum parasites with a novel dihydroorotate dehydrogenase (DHODH) inhibitor reproducibly selected for resistant parasites. Genome-wide analysis of independently-derived resistant clones revealed a two-step strategy to evolutionary success. Some haploid blood-stage parasites first survive antimalarial pressure through fortuitous DNA duplications that always included the DHODH gene. Independently-selected parasites had different sized amplification units but they were always flanked by distant A/T tracks. Higher level amplification and resistance was attained using a second, more efficient and more accurate, mechanism for head-to-tail expansion of the founder unit. This second homology-based process could faithfully tune DNA copy numbers in either direction, always retaining the unique DNA amplification sequence from the original A/T-mediated duplication for that parasite line. Pseudo-polyploidy at relevant genomic loci sets the stage for gaining additional mutations at the locus of interest. Overall, we reveal a population-based genomic strategy for mutagenesis that operates in human stages of P. falciparum to efficiently yield resistance-causing genetic changes at the correct locus in a successful parasite. Importantly, these founding events arise with precision; no other new amplifications are seen in the resistant haploid blood stage parasite. This minimizes the need for meiotic genetic cleansing that can only occur in sexual stage development of the parasite in mosquitoes.


Conflict of interest statement

The authors have declared that no competing interests exist.

Figures

Figure 1
Figure 1. Schematic history of clones selected for varying DSM1 resistance.
Color codes are conserved in all figures. Clones used in the drug removal experiments are shown with a “*” and underlined clone names were Illumina sequenced. The round 2 naming convention is as follows: first position, letter of the round 1 clone from which it was derived; second position, number of parasites used in selection (5 refers to 105, 7 refers to 107); third position, concentration of DSM1 used during selection (µM, structure shown as inset on right); last position, refers to clone number.
Figure 2
Figure 2. Genes within DHODH amplicons from round 1 clones.
A. Mid-density microarray results of round 1 clone C (other clones, Fig. S1) showing a 70 kb amplicon at the beginning of chromosome 6 (DHODH amplicon). B. Gene coverage (spotted microarray) of the DHODH amplicon (D (blue); C (green); E (red); F (magenta). Average log2 ratios are calculated from 3 experimental replicates over 1–3 probes per gene. There were no other significant amplifications detected anywhere in the genome (significance cut off >1.5 fold change, FDR <10%). Gene numbers 1–25 correspond to those listed in Table S7. C. Summary of DHODH amplicon size (both spotted and mid-density microarrays). The DHODH target gene (no. 19) is depicted in red, A/T tracks at amplicon junctions are indicated by a grey circle (black outline, shared junction; red outline, junction within introns). The amplicon boundaries of each clone were verified using qPCR (Fig. S8). D. Confirmation of DHODH copy number by qPCR. Front and rear primers (Table S12) were used to detect the DHODH gene. Values are relative to Dd2 (grey) and normalized against seryl t-RNA synthetase (PF07_0073) copy number. Error bars depict standard error. Significance was determined against Dd2 (*, p value<0.05 and **, p value<0.005).
Figure 3
Figure 3. Whole genome sequencing to characterize junctions of DHODH amplicon units.
A. Histograms of normalized read coverage comparing single-copy Dd2 (grey), round 1, and 2 clones (C-derived, green; D-derived, blue). The scale depicts chromosome 6 position and boxes below represent ORF locations. All histograms are plotted on the same scale; increases in height correlate to increased number of reads from amplifications. Position of DHODH (vertical grey highlight), junction regions 1 and 2 for C (vertical green highlight) and D (vertical blue highlight)-derived clones. B and C. Mapping of DHODH amplicon junctions using whole genome sequencing data from C (panel B) and D (panel C)-derived clones. Reads that aligned on either side of the junctions were queried for their paired-end alignments to determine amplicon orientation (Fig. S6). Red arrows; reads that align upstream of the amplicon edge, Yellow arrows; downstream of amplicon edge, Green/blue arrows; within the amplicon. Junction positions for each clone are indicated below histograms. *, reads from this position also map to position ∼1300500 (chromosome 6). D. Schematic of the tandem head-to-tail orientation of the various clones and the number of amplified regions (arrows) in the Dd2 parent and each resistant clone.
Figure 4
Figure 4. Parallel increases and decreases in DSM1 sensitivities and DHODH amplicons.
A. Changes in DSM1 sensitivity of Dd2 (open circle) and C-derived clones (C53-1 (square) and C710-1b (triangle)) from a representative dose response experiment (EC50 values and full list of experiments, Table S9). B. DHODH qPCR showing further amplification in round 2 clones (round 1 C clone included for comparison and used to determine significance). Values are relative to Dd2 (Table S6) and normalized against PF07_0073 and MAL13P1.435. C. Mid-density microarray result from a representative round 2 clone C53-1 (relative to Dd2) showing an increased log2 ratio of the DHODH amplicon on chromosome 6 (mean log2 ratios for all comparisons, Table S6). D and E. DSM1dose response curve of C53-1 (D) and C710-1a (E) populations after growth in the presence (solid line, filled shape) or in the absence (dotted lines, open shapes) of DSM1 for 0 (circle), 1 (square), 2 (triangle), and 3 (diamond) months. F and G. DHODH qPCR analysis of C53-1 (F) and C710-1a (G) populations after 0 to 3 months without DSM1 (black, significance was determined against the +DSM1 population) and −3 month clones (grey, DSM1 removal (DR) clones 1–4). Values are relative to Dd2 and DR clone 1 was used to determine significance. All panels: error bars depict standard error and **, p value<0.005; ***, p value<0.0005. H and I. Tuning of the DHODH amplicon: parental amplicon C clone (left, H and I); round 2 amplicons C53-1 (middle, H) and C710-1a (middle, I); DSM1 removal amplicons C53-1 DR clone 4 (right, H) and C710-1a DR clone 4 (right, I). All were compared to Dd2, except DR clones (right, H and I) were compared to the parental C clone.
Figure 5
Figure 5. Model of the two-step process that P. falciparum uses to acquire DNA amplifications.
In Step 1, random A/T tracks (grey circles) throughout the haploid genome (black line) initiate a short-homology mediated pathway through presumably either the generation of DNA double-strand breaks due to polymerase pausing or enzymatic action on DNA that is free of histone interactions (see Discussion). In our independent selections, the randomness of the duplication of the genome surrounding DHODH (light blue rectangle) is emphasized by the positions of various initiating A/T tracks (vertical dotted lines) and the generation of differently sized founder amplicons (red, purple, green, and blue bars). The amplicon junction (red line) appears to be generated from uneven “stitching” of the initiating A/T tracks from either side of the amplicon and not simply addition. In Step 2, larger stretches of homology (example green bar) likely trigger homologous recombination-like pathways in the parasite which act to conserve the original beneficial amplicons from Step 1. Long term, the condition of pseudo-plyploidy could allow the generation of mutations (yellow star) across the amplicon, which partial and complete de-amplification could resolve over time.

References

    1. White NJ (1992) Antimalarial drug resistance: the pace quickens. J Antimicrob Chemother 30: 571–585. - PubMed
    1. Sa JM, Chong JL, Wellems TE (2011) Malaria drug resistance: new observations and developments. Essays Biochem 51: 137–160. - PMC - PubMed
    1. Murray CJ, Rosenfeld LC, Lim SS, Andrews KG, Foreman KJ, et al. (2012) Global malaria mortality between 1980 and 2010: a systematic analysis. Lancet 379: 413–431. - PubMed
    1. Hay SI, Okiro EA, Gething PW, Patil AP, Tatem AJ, et al. (2010) Estimating the global clinical burden of Plasmodium falciparum malaria in 2007. PLoS Med 7: e1000290. - PMC - PubMed
    1. WHO (2012) World Malaria Report.

Publication types

MeSH terms

Substances

Associated data