. 2013 May 14:7:7.
doi: 10.3389/fnana.2013.00007. eCollection 2013.

Transcription factors define the neuroanatomical organization of the medullary reticular formation

Affiliations

Transcription factors define the neuroanatomical organization of the medullary reticular formation

Paul A Gray. Front Neuroanat. .

Abstract

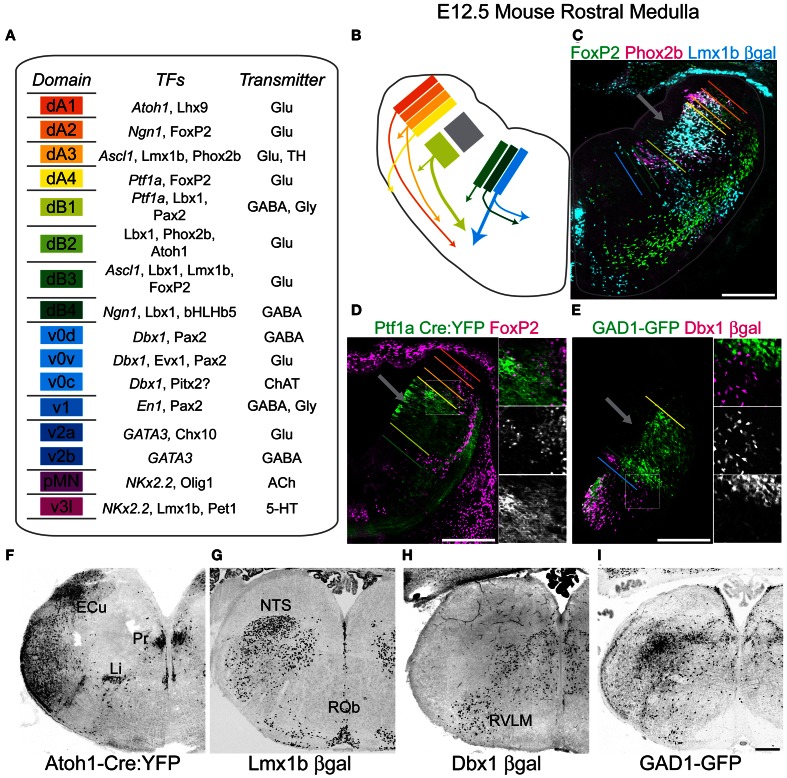
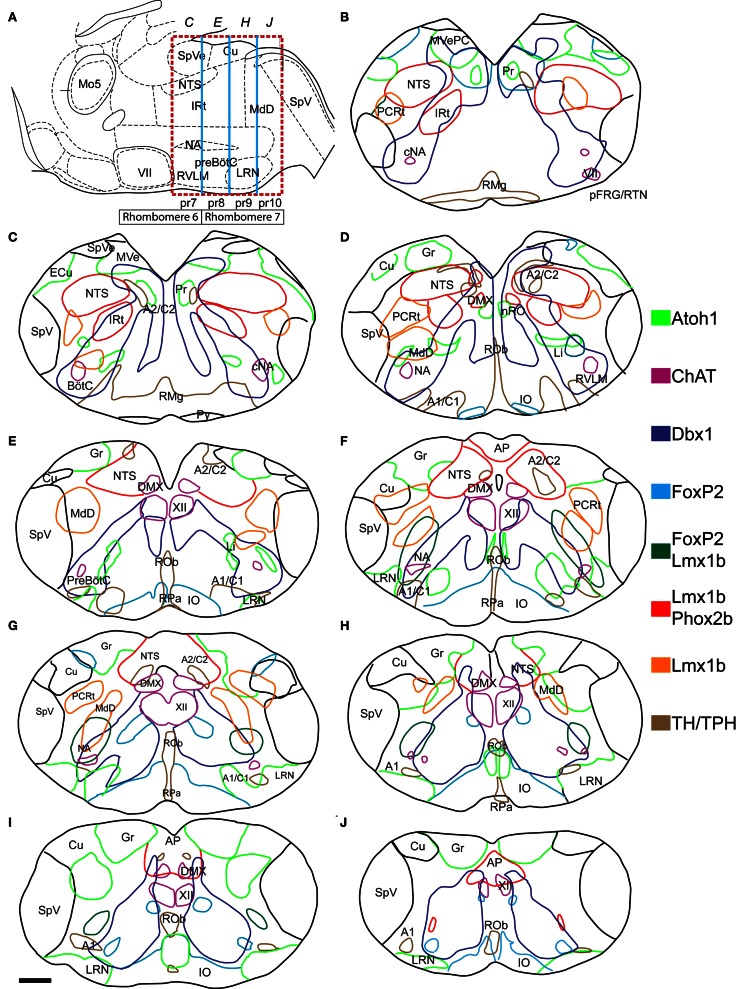
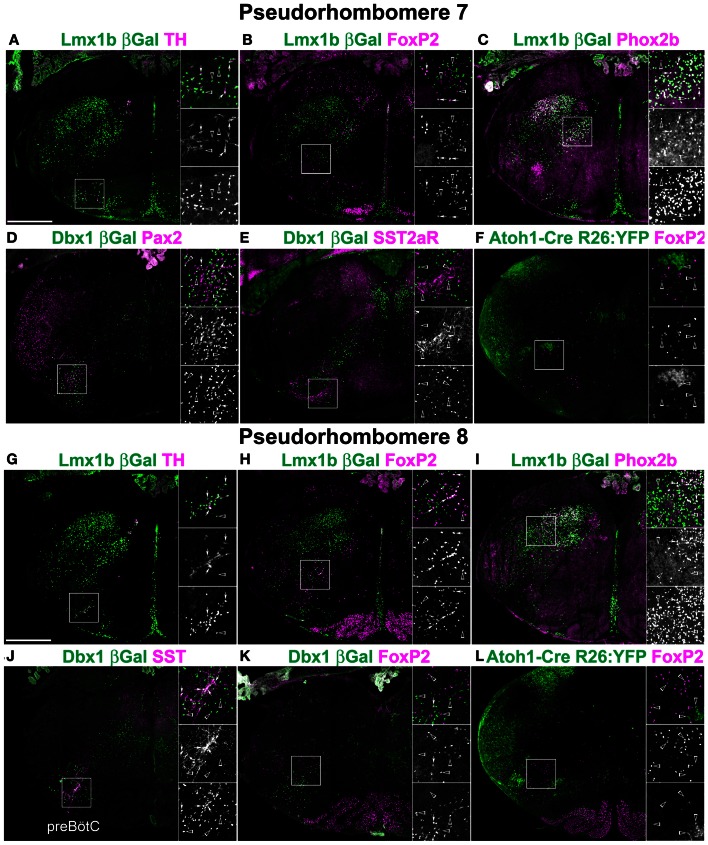
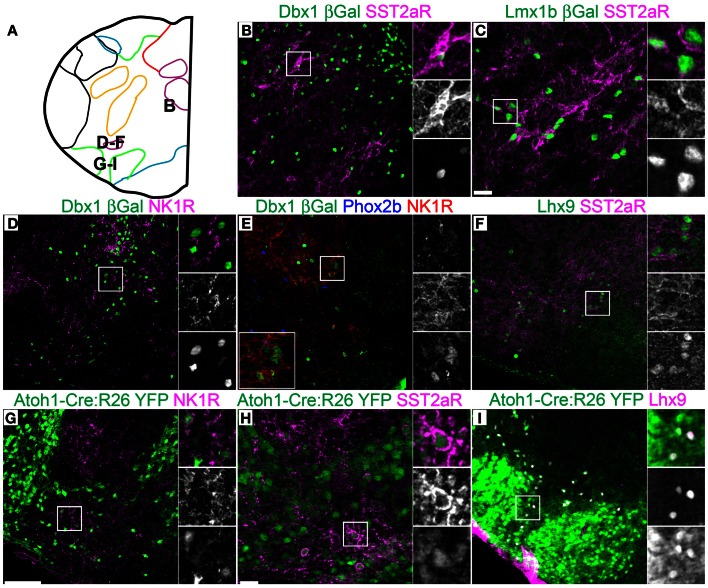
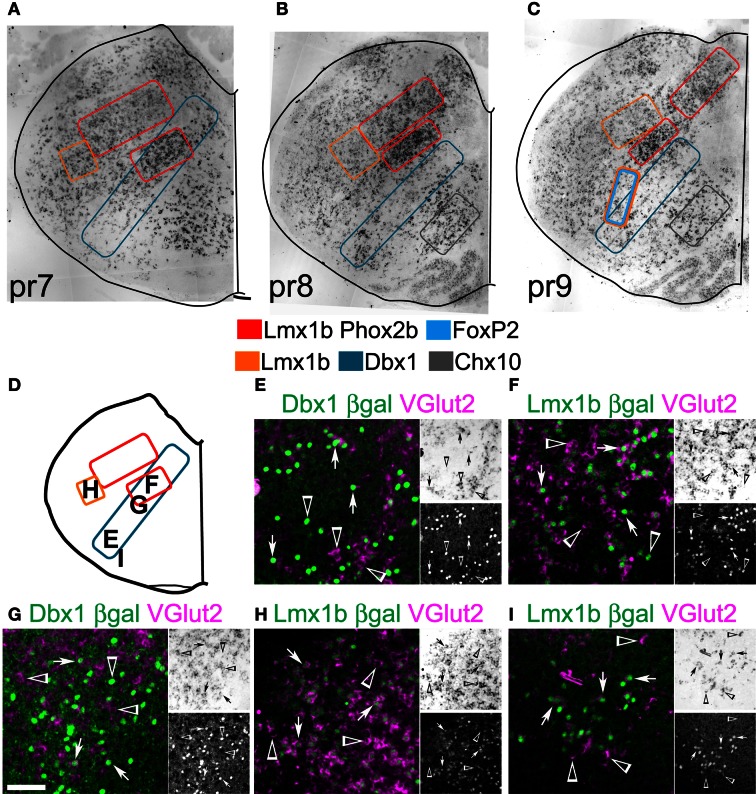
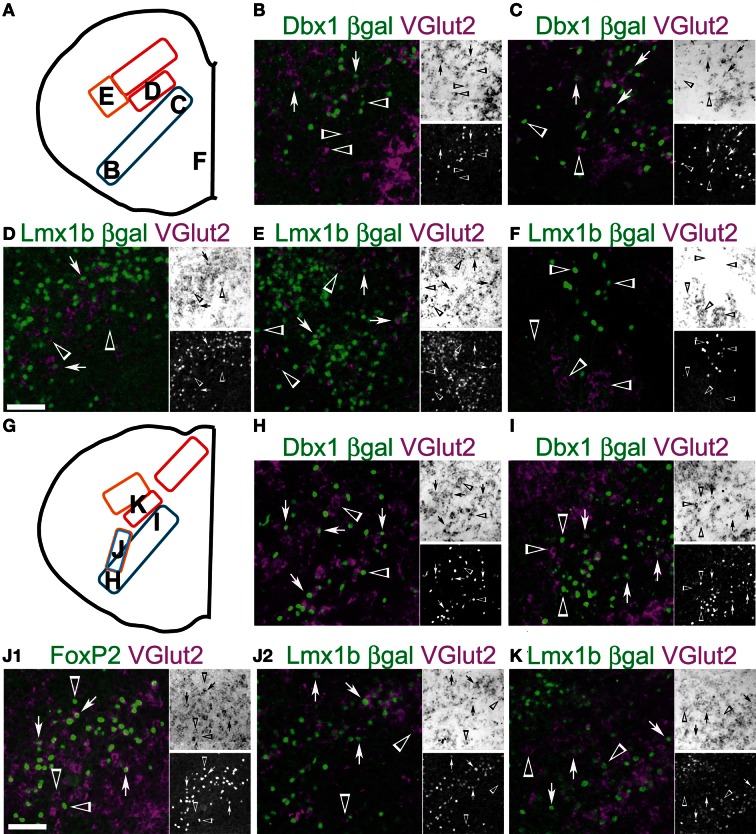
The medullary reticular formation contains large populations of inadequately described, excitatory interneurons that have been implicated in multiple homeostatic behaviors including breathing, viserosensory processing, vascular tone, and pain. Many hindbrain nuclei show a highly stereotyped pattern of localization across vertebrates suggesting a strong underlying genetic organization. Whether this is true for neurons within the reticular regions of hindbrain is unknown. Hindbrain neurons are derived from distinct developmental progenitor domains each of which expresses distinct patterns of transcription factors (TFs). These neuronal populations have distinct characteristics such as transmitter identity, migration, and connectivity suggesting developmentally expressed TFs might identify unique subpopulations of neurons within the reticular formation. A fate-mapping strategy using perinatal expression of reporter genes within Atoh1, Dbx1, Lmx1b, and Ptf1a transgenic mice coupled with immunohistochemistry (IHC) and in situ hybridization (ISH) were used to address the developmental organization of a large subset of reticular formation glutamatergic neurons. All hindbrain lineages have relatively large populations that extend the entire length of the hindbrain. Importantly, the location of neurons within each lineage was highly constrained. Lmx1b- and Dbx1- derived populations were both present in partially overlapping stripes within the reticular formation extending from dorsal to ventral brain. Within each lineage, distinct patterns of gene expression and organization were localized to specific hindbrain regions. Rostro-caudally sub-populations differ sequentially corresponding to proposed pseudo-rhombomereic boundaries. Dorsal-ventrally, sub-populations correspond to specific migratory positions. Together these data suggests the reticular formation is organized by a highly stereotyped developmental logic.

Keywords: brainstem; development; fate-mapping; hindbrain; reticular formation; rhombomeres; transcription factors.


Figures

Figure 1
Figure 1
Genetic diversity of hindbrain neurons. (A) Schematized diagram describing brainstem progenitor domains for eight dorsal (dA1–dB4) and 8 ventral progenitor populations (v0–v3l) based on their relative dorso-ventral location during neurogenesis (left). Partial list of transcription factors expressed within progenitors (italics) or post-mitotic neurons within each domain (middle). Neurotransmitter identity of neurons derived from each domain (right). (B) Cartoon showing partial migratory path of ventral medulla neurons in embryonic mouse brainstem. Colors correspond to domains in (A). Thick arrows correspond to populations migrating to ventrolateral medulla. (C) Pseudo-color confocal image of FoxP2 (green), Pho×2b (magenta), and βgal (cyan) expression in an E13.5 Lmx1b-βgal mouse showing the origin and migration of hindbrain neurons. Colored bars correspond to boundaries of progenitor domains from (A). (D) Pseudo-color confocal image of FoxP2 (magenta) and YFP (green) expression in E13.5 Ptf1a-Cre; R26 YFP medulla. Region in box is expanded to right showing overlapping (top), FoxP2 (middle), and YFP (bottom) expression. Colored bars correspond to boundaries of progenitor domains from (A). (E) Pseudo-color confocal image of intrinsic GFP (green) and βgal (magenta) expression from E13.5 GAD1-GFP; Dbx1-βgal double transgenic mouse. Region in box is expanded to right showing overlapping (top), βgal (middle), and GFP (bottom) expression. Inverted confocal mosaic image showing localization of lineage derived neurons in hemisections from rostral medulla from P0 Atoh1 (F), Lmx1b (G), Dbx1 (H), and GAD1 (I) transgenic mice. Scale bar = 500 μm.
Figure 2
Figure 2
Atlas of reticular formation developmental origin in neonate mouse medulla. (A) Mid-sagittal cartoon showing approximate region of mapping (red dashed box). Boxes below hindbrain indicate rhombomere 6 and 7 boundaries. Blue lines indicate pseudo-rhombomere 7–10 boundaries. Italicized letters indicate rostro-caudal position of sections in map. Image modified from Franklin (1997). (B–J) Outlines of medullary sections from rostral (B) to caudal (J) are shown. Sections are separated by 100 μm. Colored lines indicate regions where cells expressing or derived from specific TF lineage are present in P0 mouse (see legend). Red indicates regions of Lmx1b and Phox2b co-expression. Location of motoneurons and monoaminergic populations are included for reference. Scale bar = 500 μm. See abbreviations for explanation of text.
Figure 3
Figure 3
Segmental organization of combinatorial patterns of gene expression within rostral medulla hindbrain lineages. Pseudo-color fluorescent confocal mosaic hemi-sections from P0 transgenic mice at the level of pseudo-rhombomere 7 (A–F) and 8 (G–L). Images from Lmx1b-βgal (A–C,G–I), Dbx1-βgal (D,E,J,K), and Atoh1-Cre; R26YFP (F,L) mice showing localization of lineage reporter (green) β-Gal (A–E,G–K) or YFP (F,L) with reference genes (magenta) TH (A,G) FoxP2 (B,F,H,K,L) Phox2b (C,I) Pax2 (D), SST2aR (E), or SST (J). Boxed region in each image is expanded to right showing overlapping (top), and single colors magenta (middle), and green (bottom). Arrows indicate co-expression. Arrowheads indicate absence of co-expression. See Figures 2C,E for identification of specific regions. Scale bar = 500 μm.
Figure 4
Figure 4
Segmental organization of combinatorial patterns of gene expression within caudal medullary hindbrain lineages. Pseudo-color fluorescent confocal mosaic hemi-sections from P0 transgenic mice at the level of pseudo-rhombomere 9 (A–F) and 10 (G–L). Images from Lmx1b-βgal (A–C,G,H,J), Ptf1a-Cre; R26YFP (D, I) Dbx1-βgal (E,L), and Atoh1-Cre; R26YFP (F,K) mice showing localization of lineage reporter (green) βGal (A–C,E,G,H,J,L), or YFP (D,F,I,K) with reference genes (magenta) TH (A,G), FoxP2 (B,D–F,H,I,K), Phox2b (C,J), or Pax2 (L). Arrows indicate co-expression. Boxed regions are expanded to right showing overlapping (top), and single colors magenta (middle), and green (bottom). Scale bar = 500 μm.
Figure 5
Figure 5
Pseudo-rhombomere 7 specific patterns of gene expression. Pseudo-color fluorescent confocal mosaic images from P0 transgenic mouse at the level of pseudo-rhombomere 7. (A) Schematic image modified from Figure 2C indicating location of co-expressing populations shown in (B–I). (B–I) Images from Dbxl-βgal (B,G,H), Lmx1b-βgal (C), Atoh1-Cre; R26YFP (D–F) and Ptf1a-Cre; R26YFP (I) mice showing localization of lineage reporter β-gal (B,C, magenta, G,H, blue), or YFP (D–F, green) with ChAT (B,C, green), Lhx9 (D, magenta), NK1R (E, magenta, H, red), SST2aR (F,I, magenta, G, red), and Phox2b (G,H, green). Boxed regions in (B–F,I) are expanded to right showing overlapping (right, top), and single colors magenta (middle), and green (bottom). Boxed regions in (G,H) are expanded (inset) with single colors red (right, top), green (middle), and blue (bottom). Scale bar = 500 μm.
Figure 6
Figure 6
Pseudo-rhombomere 8 specific patterns of gene expression. Pseudo-color fluorescent confocal mosaic images from P0 transgenic mouse at the level of pseudo-rhombomere 8. (A) Schematic image modified from Figure 2E indicating location of co-expressing populations shown in (B–H). (B–H) Images from Lmx1b-βgal (B), Atoh1-Cre; Rosa26YFP (C,F,G), Dbx1-βgal (D,E),and wild type (H) mice showing localization of lineage reporter (green) βgal (B,D, green, E, blue), or YFP (C,F,G) with TH (B), SST2aR (C,E,H), NK1R (E,H), Phox2b (E), and Lhx9 (F,H). Text color indicates gene color in images. Boxed region in (B–D,F–H) is expanded to right showing overlapping (right, top), and single colors magenta (middle), and green (bottom). Boxed region in (E) is expanded (top) with single colors red (right, top), green (middle), and blue (bottom). Scale bar = 500 μm.
Figure 7
Figure 7
Pseudo-rhombomere 9 specific patterns of gene expression. Pseudo-color fluorescent confocal mosaic images from P0 transgenic mouse at the level of pseudo-rhombomere 9. (A) Schematic image modified from Figure 2G indicating location of co-expressing populations shown in (B–I). (B–I) Images from Dbx1-βgal (B,D,E), Lmx1b-βgal (C), wild type (F), and Atoh1-Cre; R26YFP (G–I) mice showing localization of lineage reporter (green) β-gal (B–E) or YFP (G–I) with SST2aR (B,C,H), NK1R (D,E,G), or Lhx9 (I). Text color indicates gene color in images. Boxed region in (B–E,G–I) is expanded to right showing overlapping (right, top), and single colors magenta (middle), and green (bottom). Boxed region in (E) is expanded (bottom left) with single colors red (right, top), green (middle), and blue (bottom). Scale bar = 500 μm.
Figure 8
Figure 8
Developmental origin of medullary reticular formation glutamatergic neurons. Brightfield in situ hybridization of VGlut2 mRNA from P0 mouse brain overlain with modified outlines from brain outlines from Figures 2C (A, pr7), 2E (B, pr8), and 2G (C, pr9). Colored boxes indicate populations derived from distinct developmental lineages (see legend). (D) Schematic image modified from Figure 2C indicating location of glutamatergic populations of pr7 shown in (E–I). (E–I) Images showing inverted VGlut2 mRNA (magenta) and βgal (green) from Dbx1-βgal (E,G), and Lmx1b-βgal (F,H,I). Single color images shown to right. VGlut2 (top, brightfield), β-Gal (bottom). Arrows indicate co-expression. Arrowheads indicate absence of co-expression. Scale bar = 500 μm.
Figure 9
Figure 9
Developmental origin of medullary reticular formation glutamatergic neurons. Schematic image modified from Figure 2E (A) or from Figure 2G (G) indicating location of glutamatergic populations of pr8 (B-F) or pr9 (H-K). (B-F, G-K) Images showing inverted VGlut2 mRNA (magenta), βgal (green), and FoxP2 (J1, green) from Dbx1-βgal (B, C, H, I), Lmx1b-βgal (D-F, J2-K) and wild type (J1) mice. Note (J1) and (J2) are from the same region from different animals. Single color images shown to right. VGlut2 (top, brightfield), βGal (bottom). Arrows indicate co-expression. Arrowheads indicate absence of co-expression. Scale bar = 500 μm.

Similar articles

Cited by

References

    1. Abbott S. B., Kanbar R., Bochorishvili G., Coates M. B., Stornetta R. L., Guyenet P. G. (2012). C1 neurons excite locus coeruleus and A5 noradrenergic neurons along with sympathetic outflow in rats. J. Physiol. 590, 2897–2915 10.1113/jphysiol.2012.232157 - DOI - PMC - PubMed
    1. Alenina N., Bashammakh S., Bader M. (2006). Specification and differentiation of serotonergic neurons. Stem Cell Rev. 2, 5–10 10.1007/s12015-006-0002-2 - DOI - PubMed
    1. Almeida A., Cobos A., Tavares I., Lima D. (2002). Brain afferents to the medullary dorsal reticular nucleus: a retrograde and anterograde tracing study in the rat. Eur. J. Neurosci. 16, 81–95 10.1046/j.1460-9568.2002.02058.x - DOI - PubMed
    1. Almeida A., Lima D. (1997). Activation by cutaneous or visceral noxious stimulation of spinal neurons projecting to the medullary dorsal reticular nucleus in the rat: a c-fos study. Eur. J. Neurosci. 9, 686–695 - PubMed
    1. Almeida A., Storkson R., Lima D., Hole K., Tjolsen A. (1999). The medullary dorsal reticular nucleus facilitates pain behaviour induced by formalin in the rat. Eur. J. Neurosci. 11, 110–122 10.1046/j.1460-9568.1999.00411.x - DOI - PubMed

LinkOut - more resources