. 2013 May 23;8(5):e63279.
doi: 10.1371/journal.pone.0063279. Print 2013.

Staphylococcus aureus-induced G2/M phase transition delay in host epithelial cells increases bacterial infective efficiency

Affiliations

Staphylococcus aureus-induced G2/M phase transition delay in host epithelial cells increases bacterial infective efficiency

Ludmila Alekseeva et al. PLoS One. .

Abstract

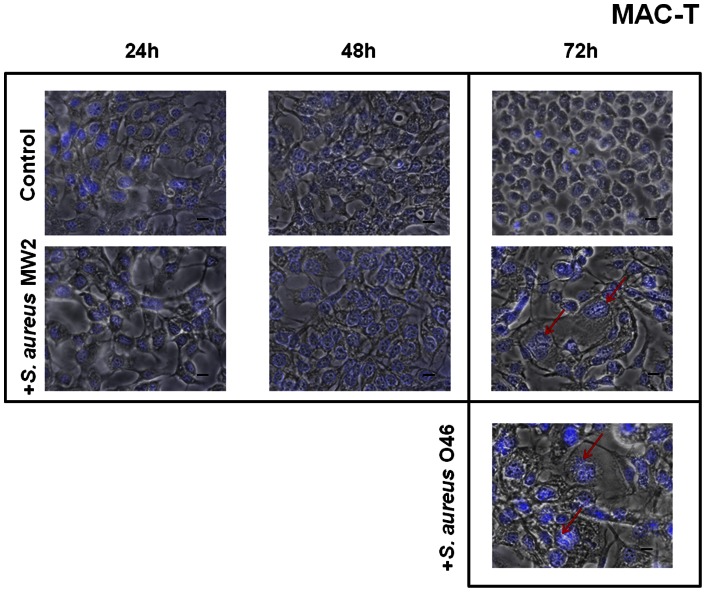
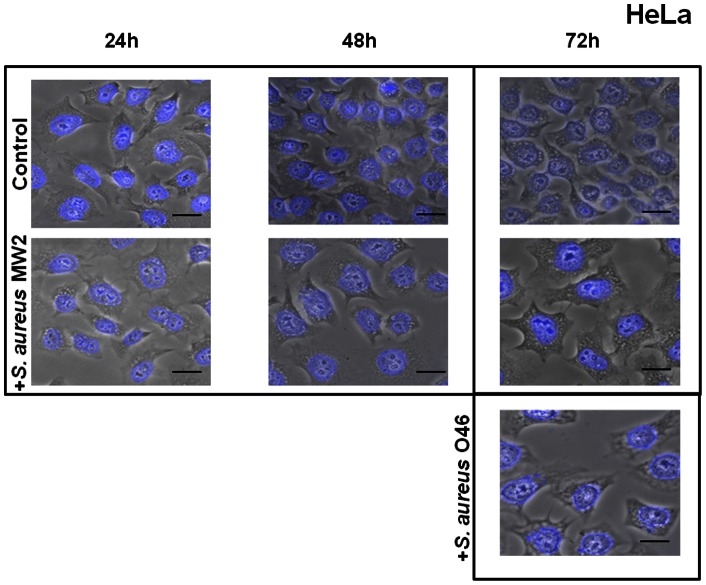
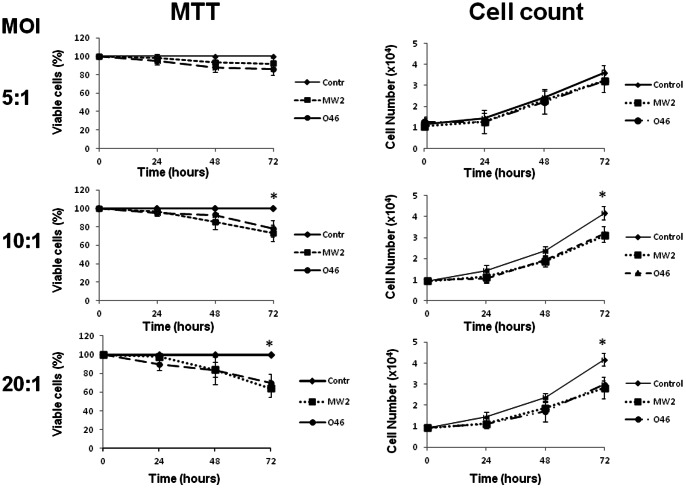
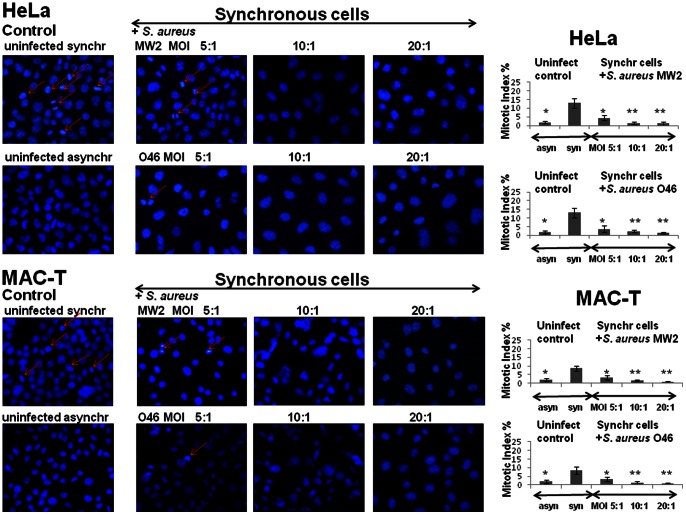
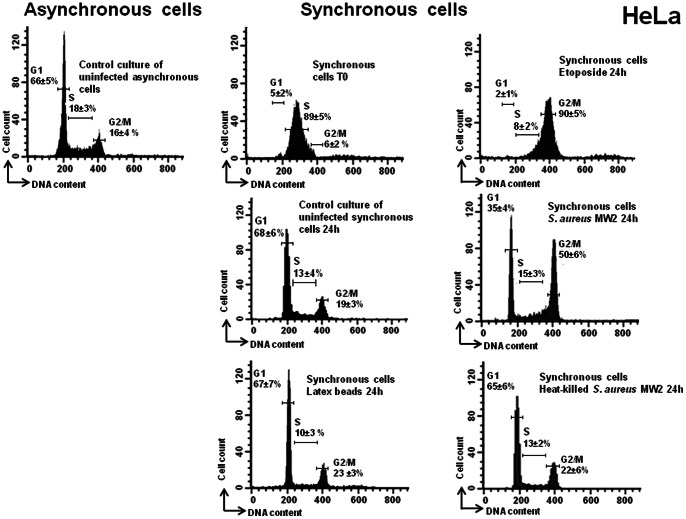
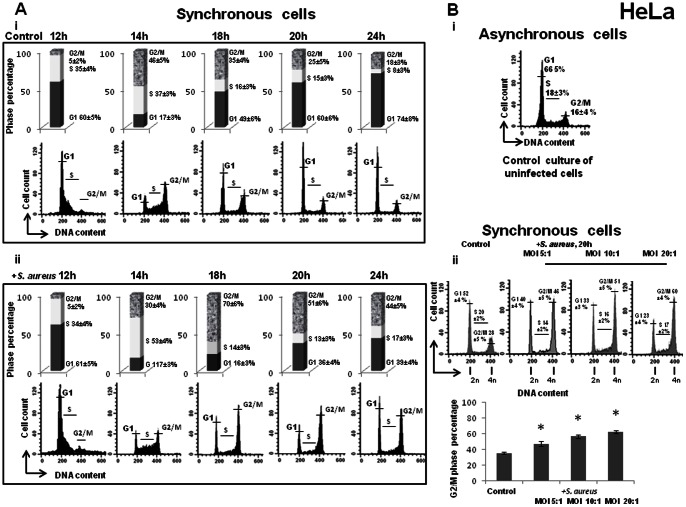
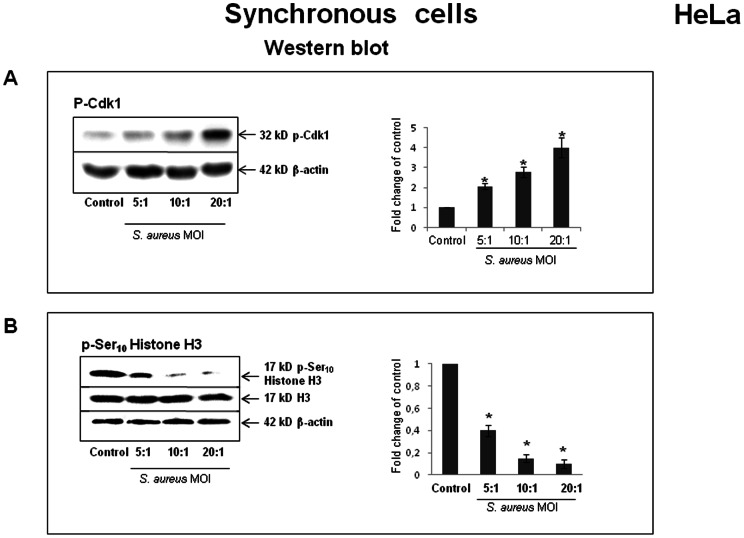
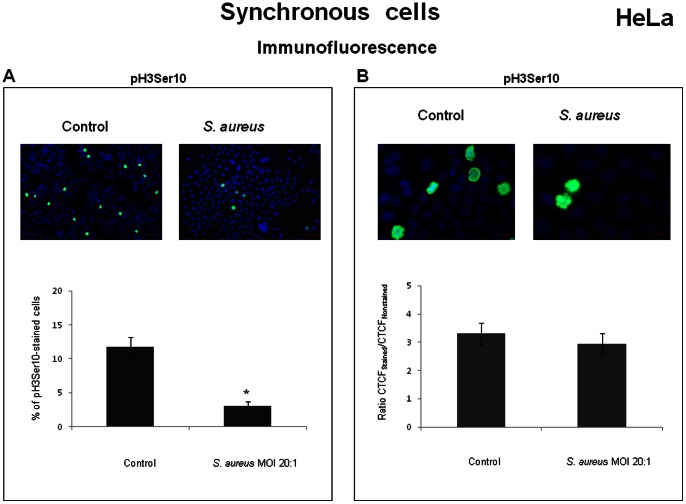
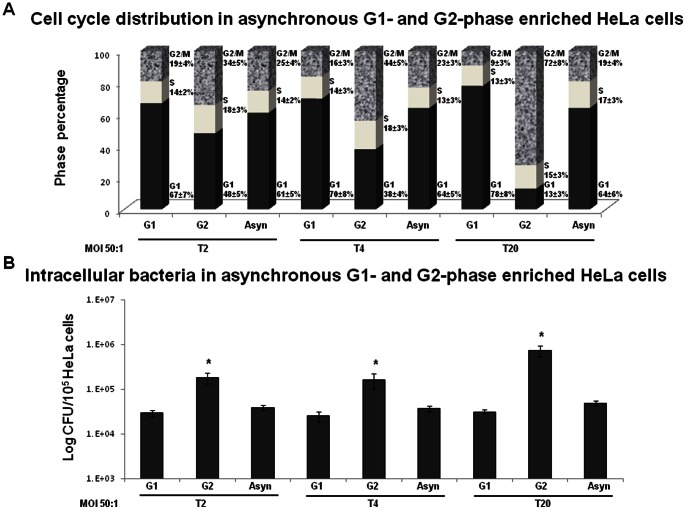
Staphylococcus aureus is a highly versatile, opportunistic pathogen and the etiological agent of a wide range of infections in humans and warm-blooded animals. The epithelial surface is its principal site of colonization and infection. In this work, we investigated the cytopathic effect of S. aureus strains from human and animal origins and their ability to affect the host cell cycle in human HeLa and bovine MAC-T epithelial cell lines. S. aureus invasion slowed down cell proliferation and induced a cytopathic effect, resulting in the enlargement of host cells. A dramatic decrease in the number of mitotic cells was observed in the infected cultures. Flow cytometry analysis revealed an S. aureus-induced delay in the G2/M phase transition in synchronous HeLa cells. This delay required the presence of live S. aureus since the addition of the heat-killed bacteria did not alter the cell cycle. The results of Western blot experiments showed that the G2/M transition delay was associated with the accumulation of inactive cyclin-dependent kinase Cdk1, a key inducer of mitosis entry, and with the accumulation of unphosphorylated histone H3, which was correlated with a reduction of the mitotic cell number. Analysis of S. aureus proliferation in asynchronous, G1- and G2-phase-enriched HeLa cells showed that the G2 phase was preferential for bacterial infective efficiency, suggesting that the G2 phase delay may be used by S. aureus for propagation within the host. Taken together, our results divulge the potential of S. aureus in the subversion of key cellular processes such as cell cycle progression, and shed light on the biological significance of S. aureus-induced host cell cycle alteration.


Conflict of interest statement

Competing Interests: The authors have declared that no competing interests exist.

Figures

Figure 1
Figure 1. Enlargement of MAC-T cells exposed to S. aureus.
Bovine MAC-T cells were exposed for 2 h to S. aureus MW2 or O46 MOI 20∶1, treated with gentamicin for 2 h and further incubated for 24 h, 48 h and 72 h. After incubation, the cells were fixed, stained with DAPI and observed using ×400 magnification. The merged image of phase contrast and DAPI-stained cells is presented. Red arrows indicate the enlarged cells in infected cell cultures. Scale bars: 10 µm. A. MAC-T cells exposed to S. aureus MW2 for 24 h, 48 h and 72 h at MOI 20∶1. B. MAC-T cells exposed to S. aureus O46 for 72 h at MOI 20∶1.
Figure 2
Figure 2. Enlargement of HeLa cells exposed to S. aureus.
Human HeLa cells were exposed for 2 h to S. aureus MW2 or O46 at MOI 20∶1 and further incubated for 24 h, 48 h and 72 h. After incubation, the cells were fixed, stained with DAPI and observed using ×400 magnification. The merged image of phase contrast and DAPI-stained cells is presented. Red arrows indicate the enlarged cells in infected cell cultures. Scale bars: 10 µm. A. Cells exposed to S. aureus MW2 for 24 h, 48 h and 72 h at MOI 20∶1. B. Cells exposed to S. aureus O46 for 72 h at MOI 20∶1.
Figure 3
Figure 3. S. aureus inhibited cell growth.
MAC-T cells were exposed to S. aureus MW2 or O46 for 2 h at MOIs ranging from 5∶1 to 20∶1 and further incubated for 24 h, 48 h and 72 h (control: black rhombus; MW2: black square; 046: black circle) and the number of cells was determined (cell count). Cell viability was evaluated by MTT. The results are shown as the percentage of the control. Data are presented as mean +/− SD. Each experiment was done in triplicate. The differences among the groups were assessed by ANOVA. Tukey's Honestly Significant Difference test was applied for comparison of means.
Figure 4
Figure 4. Substantial drop in the mitotic index in S. aureus-infected cells.
HeLa or MAC-T cells were synchronized by DTB and were then exposed to MW2 or O46 strains at MOIs ranging from 5∶1 to 20∶1 for 2 h, followed by incubation in cDMEM-Gent100 for 2 h, and further incubated for 25 h. After centrifugation, the cells were fixed and stained with DAPI. Red arrows indicate the mitotic cells. The mitotic indexes in infected and in uninfected synchronous cells were evaluated by microscopic observation using ×400 magnification. Data are presented as mean +/− SD. The differences among the groups were assessed by ANOVA. (*) P-values <0.05 and (**) P-values <0.01 compared with the control were considered to be significant. Tukey's Honestly Significant Difference test was applied for comparison of means between the groups.
Figure 5
Figure 5. S. aureus induced a G2/M phase transition delay.
HeLa cells were synchronized by DTB and were exposed to live or heat-killed bacteria (MW2) at MOI 20∶1, to the latex beads or to the media alone for 2 h, followed by incubation in cDMEM-Gent100 for 2 h, and further incubated for 24 h. Some cells were exposed to etoposide for the same length of time as the exposure to bacteria. Detached cells were then combined with adherent cells and stained with PI. Cell cycle phases of PI-stained cells were monitored by FACS. The data were collected from 20,000 cells and analysis was performed with Cell Quest software. The average percentage of cell cycle phase ± SD is indicated. Each experiment was performed at least five times. Exposure of the cells to live S. aureus bacteria induced an increase in the number of cells in the G2/M phase, (*) p<0.05.
Figure 6
Figure 6. S. aureus induced dose-dependent G2/M phase transition delay in the subsequent G2/M phase.
A. HeLa cells were synchronized by DTB and were exposed to S. aureus bacteria (MW2) at MOI 20∶1 or to the media alone for 2 h, followed by incubation in cDMEM-Gent100 for 2 h, and subsequently incubated for an additional 12 h, 14 h, 18 h, 20 h and 24 h. Detached cells were then combined with adherent cells and stained with PI. Cell cycle phases of PI-stained cells were monitored by FACS. The data were collected from 20,000 cells and analysis was performed with Cell Quest software. Each experiment was performed four times. The number of cells in different phases is presented on the histograms. The values shown are those of a representative assay out of the four assays performed. Exposure of the cells to S. aureus bacteria induced a G2/M phase transition delay in a time-dependent manner. B. HeLa cells were synchronized by DTB and were exposed to S. aureus bacteria (MW2) at different MOIs ranging from 5∶1 to 20∶1, followed by incubation in cDMEM-Gent100 for 2 h, and further incubated for an additional 20 h. Detached cells were then combined with adherent cells and stained with PI. Cell cycle phases of PI-stained cells were monitored by FACS. The data were collected from 20,000 cells and analysis was performed with Cell Quest software. The percentage of cells is presented on the graph as a function of bacterial concentration. The data correspond to a representative experiment out of the three assays performed and are presented as mean +/− SD. Tukey's Honestly Significant Difference test was applied for comparison of means between the groups. (*) P-values <0.05 compared with control were considered to be significant. Exposure of the cells to S. aureus bacteria induced a G2/M phase transition delay in a dose-dependent manner.
Figure 7
Figure 7. S. aureus-induced accumulation of phosphorylated Cdk1 and unphosphorylated Ser10 Histone H3.
HeLa cells were synchronized by DTB and were exposed to S. aureus bacteria (MW2) at MOIs ranging from 5∶1 to 20∶1 for 2 h, followed by incubation in cDMEM-Gent100 for 2 h, and further incubated for 20 h. Cells were then suspended in Laemmli loading buffer, and Western blot analysis, either with anti-phospho-Cdk1 antibodies or anti-p-Ser10 Histone H3 antibody, was performed as described in the Materials and Methods section. The chemiluminescence reaction was visualized and processed with a G:BOX imaging system. Blots are representative of three separate experiments. Data are presented as mean ± SD from three densitometry scans. Tukey's Honestly Significant Difference test was applied for comparison of means between the groups. (*) P-values <0.05 compared with the control were considered to be significant.
Figure 8
Figure 8. S. aureus decreased the number of p-Ser10 Histone H3-positive nuclei in infected culture.
HeLa cells were synchronized by DTB and were then exposed to MW2 strain at MOI 20∶1 for 2 h, followed by incubation in cDMEM-Gent100 for 2 h, and further incubated for 20 h. After centrifugation, the cells were fixed, stained with anti-p-Ser10 Histone H3 antibody and DAPI, and observed under the microscope. The relative level of fluorescence (CTCF) of p-Ser10 Histone H3-positive mitotic nuclei was measured with ImageJ software. Data are presented as mean +/− SD. Tukey's Honestly Significant Difference test was applied for comparison of means between the groups. (*) P<0.05 compared with the synchronous control. A decrease in the number of p-Ser10 Histone H3-positive nuclei was observed in S. aureus-infected culture (A, scale bars: 100 µm). Estimation of the relative fluorescence intensity of p-Ser10 Histone H3-stained mitotic cells did not reveal statistically significant differences between infected and non-infected cultures (B, scale bars: 10 µm). The values are from the three assays performed.
Figure 9
Figure 9. Blocking HeLa cells in the G2 phase results in an increased internalization and in an increased intracellular replication of S. aureus..
HeLa cells were treated with either 10 µM CDK4/6 inhibitor IV (enrichment in the G1 phase) or 9 µM of RO-3306 (enrichment in the G2 phase) 3 h before the addition of S. aureus at MOI 10∶1 and 50∶1 for 2 h (T0). The cells then were incubated in cDMEM-Gent100 for an additional 2 h, 4 h (T4) or 20 h (T20). The proportions of cells in the different cell cycle stages at T2, T4 and T20 were determined by FACS (A). The CFU of intracellular S. aureus at T2, T4 and T20 was determined by plate count. CFU values were normalized to 105 HeLa cells (B). Experiments were performed in triplicate. The data are presented as mean +/− SD. Tukey's Honestly Significant Difference test was applied for comparison of means between the groups. (*) P<0.05 compared to asynchronously grown cells.

References

    1. Miller LS, Cho JS (2011) Immunity against Staphylococcus aureus cutaneous infections. Nature Reviews Immunology 11: 505–518. - PMC - PubMed
    1. Edwards AM, Massey RC (2011) How does Staphylococcus aureus escape the bloodstream? Trends Microbiol 19: 184–190. - PubMed
    1. Fitzgerald JR (2012) Livestock-associated Staphylococcus aureus: origin, evolution and public health threat. Trends Microbiol 20: 192–198. - PubMed
    1. Steeneveld W, van Werven T, Barkema HW, Hogeveen H (2011) Cow-specific treatment of clinical mastitis: An economic approach. J Dairy Sci 94: 174–188. - PubMed
    1. Bougarn S, Cunha P, Gilbert FB, Harmache A, Foucras G, et al. (2011) Staphylococcal-associated molecular patterns enhance expression of immune defense genes induced by IL-17 in mammary epithelial cells. Cytokine 56: 749–759. - PubMed

Publication types

LinkOut - more resources