Clinical Trial
. 2013 May 23;8(5):e63672.
doi: 10.1371/journal.pone.0063672. Print 2013.

1(OH) vitamin D3 supplementation improves the sensitivity of the immune-response during Peg-IFN/RBV therapy in chronic hepatitis C patients-case controlled trial

Affiliations
Clinical Trial

1(OH) vitamin D3 supplementation improves the sensitivity of the immune-response during Peg-IFN/RBV therapy in chronic hepatitis C patients-case controlled trial

Yasuteru Kondo et al. PLoS One. .

Abstract

Objective: 1,25(OH)2 vitamin D3 can affect immune cells. However, the mechanism responsible for the favorable effects of 1(OH) vitamin D3, which becomes 1,25(OH)2 vitamin D3 in the liver, is not clear. The aim of this study is to analyze the immunological response of 1(OH) vitamin D3 supplementation in CH-C patients.

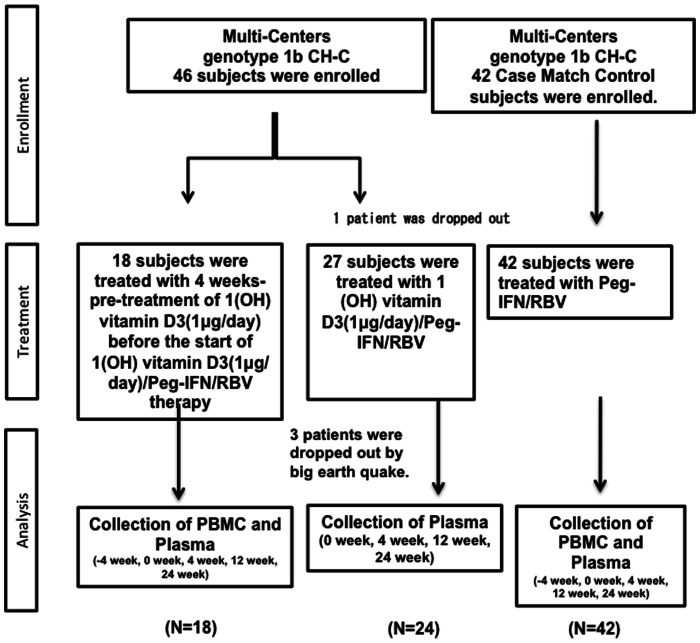
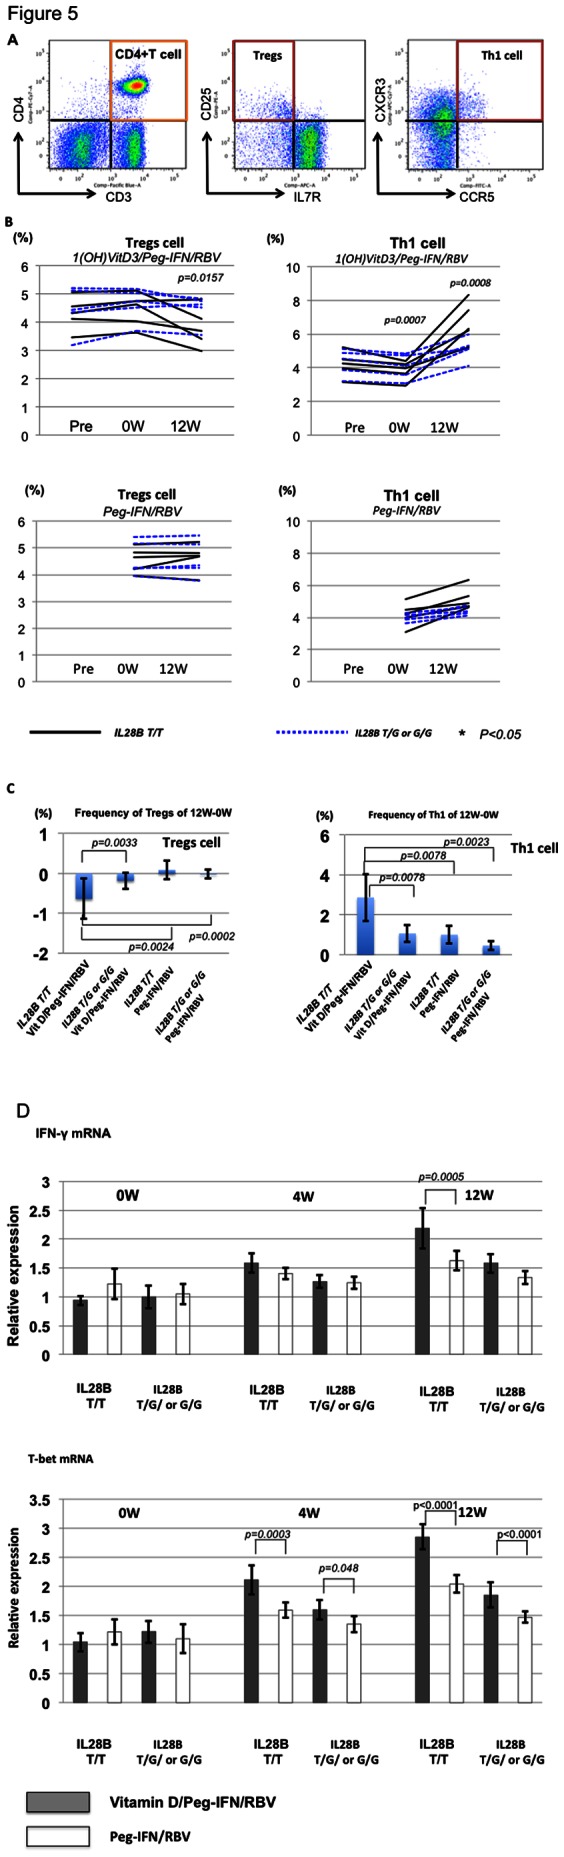
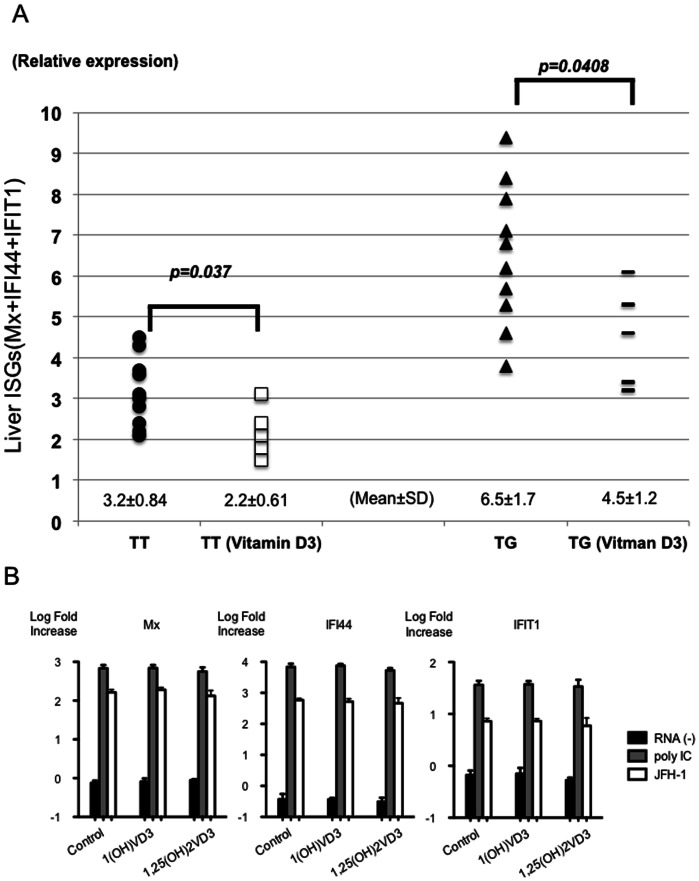
Design: Forty-two CH-C patients were treated with 1(OH) vitamin D3/Peg-IFNα/RBV. Forty-two case-matched controls were treated with Peg-IFNα/RBV. The expression of Interferon-stimulated genes (ISGs)-mRNA in the liver biopsy samples and JFH-1 replicating Huh-7 cells were quantified by real-time PCR. Ten kinds of cytokines in the plasma were quantified during treatment by using a suspension beads array. A trans-well co-culture system with peripheral blood mononuclear cells (PBMCs) and Huh-7 cells was used to analyze the effect of 1(OH) vitamin D3. The activities of the Th1 response were compared between subjects treated with 1(OH) vitamin D3/Peg-IFN/RBV and those treated with Peg-IFN/RBV therapy alone.

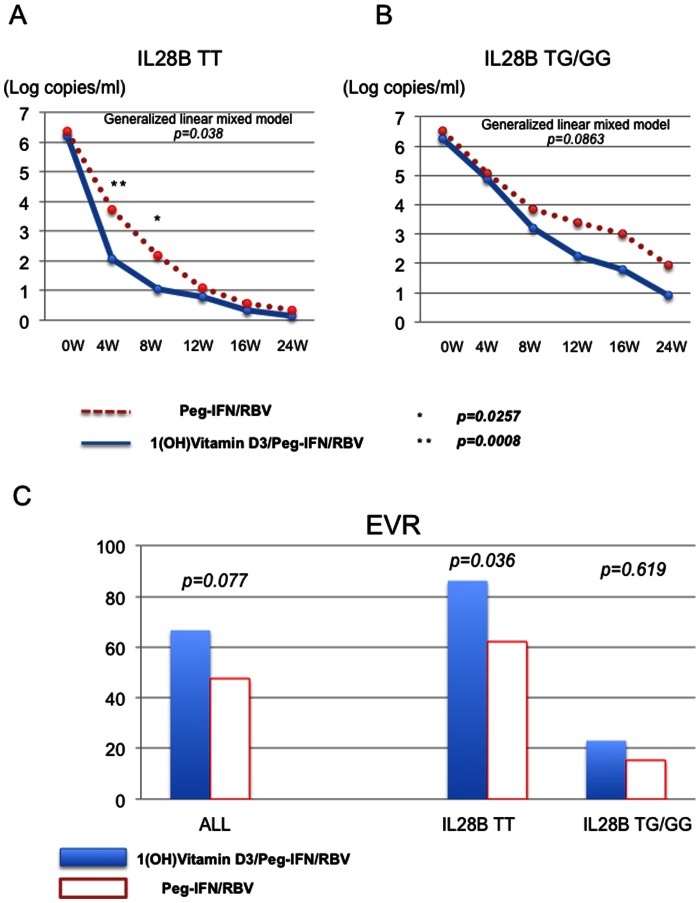
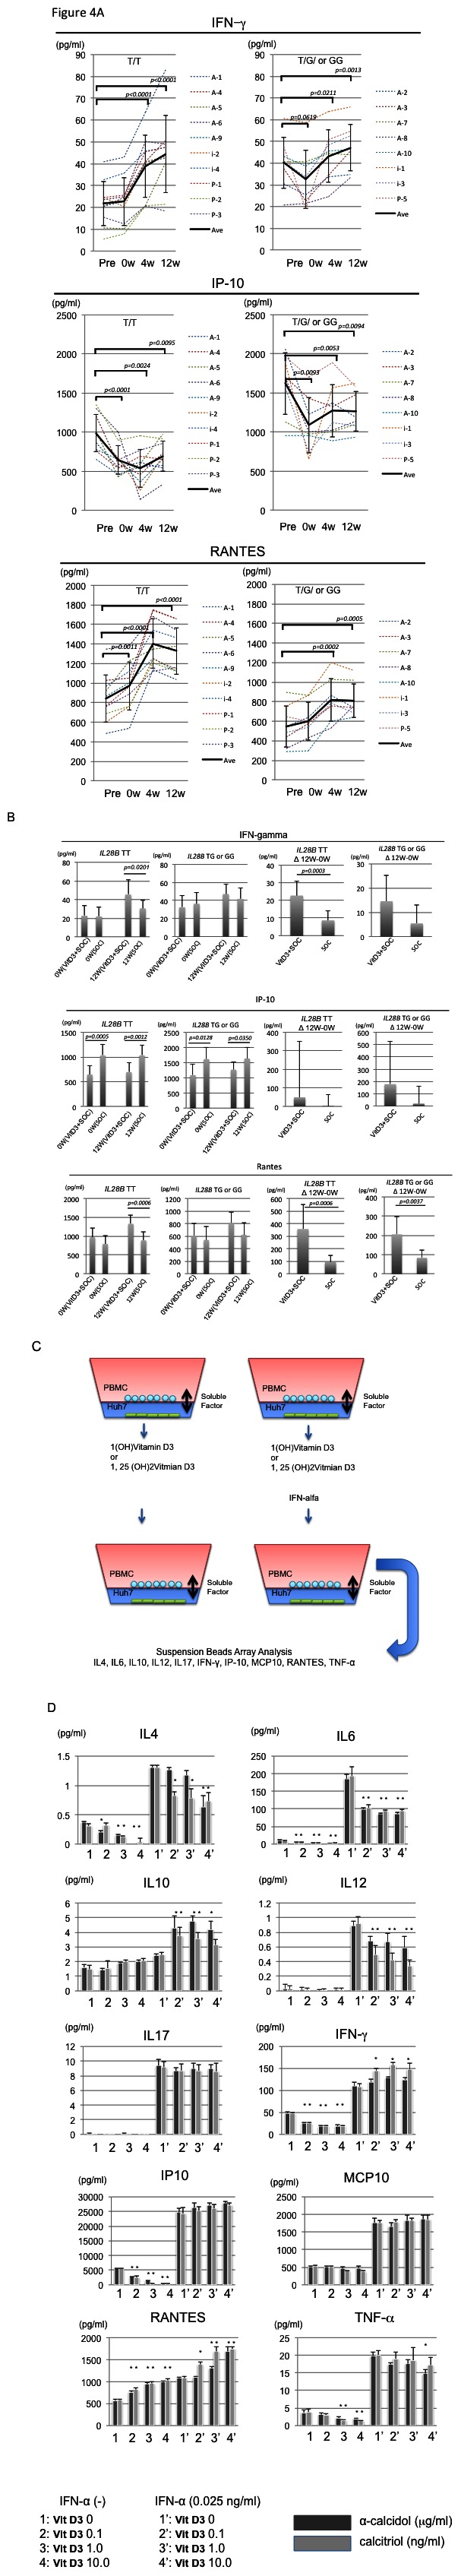
Results: 1(OH) vitamin D3/Peg-IFN/RBV treatment could induce rapid viral reduction, especially in IL28B T/T polymorphism. Several kinds of cytokines including IP-10 were significantly decreased after 4 weeks of 1(OH) vitamin D3 treatment (p<0.05). Th1 responses in the subjects treated with 1(OH) vitamin D3/Peg-IFN/RBV were significantly higher than those treated with Peg-IFN/RBV at 12 weeks after Peg-IFN/RBV therapy (p<0.05). The expression of ISGs in the patient's liver biopsy samples was significantly lower than in those treated without 1(OH) vitamin D3 (p<0.05).

Conclusion: 1(OH) vitamin D3 could improve the sensitivity of Peg-IFN/RBV therapy on HCV-infected hepatocytes by reducing the IP-10 production from PBMCs and ISGs expression in the liver.


Conflict of interest statement

Competing Interests: The authors have declared that no competing interests exist.

Figures

Figure 1
Figure 1. Enrollment of CH-C patients.
46 patients with genotype 1b and high viral loads were enrolled in this study. In total, 4 patients were dropped from this study.
Figure 2
Figure 2. Comparison of viral dynamics and treatment response.
Viral dynamics of subjects with IL28B T/T major homo polymorphism are shown (A). Viral dynamics of subjects with IL28B T/G or G/G minor polymorphism are shown (B). Blue lines indicate viral dynamics of subjects treated with 1(OH) Vitamin D3/Peg-IFN/RBV. Dotted lines indicate viral dynamics of subjects treated with Peg-IFN/RBV. *p<0.05 **p<0.01 The rates of early virological response in the patients treated with 1(OH) vitamin D3/Peg-IFN/RBV and Peg-IFN/RBV are shown (C).
Figure 3
Figure 3. Comparison of hematological and biochemical analysis between before and after 4-week 1(OH) vitamin D3 treatment.
Representative hematological, biochemical and virological data are shown. WBC indicates white blood cell count. ALT indicates alanine transaminase. HCV-RNA indicates titer of hepatits C virus RNA. PLT indicates platelet count. γ-GTP indicates gamma-glutamyl traspeptidase. T-cho indicates total cholesterol. The data at pre- and post-4weeks administration of 1(OH) vitamin D3 without Peg-IFN/RBV are shown. Black lines indicate the average of each analysis.
Figure 4
Figure 4. Cytokine profiles in the ex vivo and in vitro samples treated with vitamin D3.
Sequential data of quantification of 3 cytokines (IFN-γ, IP-10 and RANTES) during 1(OH) vitamin D3 pre-treatment (pre vs 0w), 1(OH) vitamin D3/Peg-IFN/RBV therapy are shown (A). Dotted lines indicate the data of each subject. Black lines indicate the averaged data. Error bars indicate standard deviation. The data from IL28B (T/T) subjects or IL28B (T/G or G/G) subjects are shown in the independent graphs (A). Comparisons of the amounts of 3 cytokines (IFN-γ, IP-10 and RANTES) between the 1(OH) vitamin D3/PEG-IFN/RBV group (VitD3+standard of care (SOC)) and Peg-IFN/RBV group (SOC) at 0 weeks and 12 weeks after the start of Peg-IFN/RBV treatment are shown (B). Analysis of the changes in the amounts of the 3 cytokines (IFNγ, IP-10 and RANTES) during 12 weeks treatment of Peg-IFN/RBV is shown. Schema of in vitro-analysis of co-culture is shown (B). alfa-calcidol: 1(OH)vitamin D3 and calcitriol: 1,25(OH)vitamin D3 were used to analyze the cytokine production in vitro. Black bars indicate the data from samples treated with alfa-calcidol. Gray bars indicate the data from samples treated with calcitriol. *p<0.05.
Figure 5
Figure 5. Comparison of Th1 and Tregs between 1(OH) vitamin D3/Peg-IFN/RBV and Peg-IFN/RBV.
Representative dot plots of CD3+CD4+CD25+IL7R (Tregs) and CD3+CD4+CXCR3+CCR5+ (Th1 cells) are shown. (A) Frequencies of Th1 and Tregs among the 4 groups (IL28B T/T vitamin D3/Peg-IFN/RBV, IL28B T/G or G/G vitamin D3/Peg-IFN/RBV, IL28B T/T Peg-IFN/RBV, and IL28B T/G or G/G Peg-IFN/RBV) are shown. (B) Comparison of the T-bet and IFN-γ mRNA expression between subjects treated with vitamin D3/Peg-IFN/RBV therapy and those treated with Peg-IFN/RBV therapy. Each group included 5 patients. Total mRNA was extracted from isolated CD4+ T cells. The relative expression levels are shown in bar graphs. The statistical analysis was carried out by independent student t-test.
Figure 6
Figure 6. The effect of vitamin D3 on the expression of ISGs mRNA in the liver.
The relative amount of target mRNA was obtained by using a comparative threshold cycle (CT) method. The expression levels of Mx, IFI44 or IFIT1 mRNA in an IL28B T/T patient treated without 1(OH) vitamin D3 are represented as 1.0 and the relative amounts of target mRNA in the other patients were calculated by the comparative Ct method . Therefore, the standard amount of 3 ISGs (Mx, IFI44 and IFIT1) is 3. The relative amounts of the 3 kinds of ISGs were added and shown in the graph (A). Black circles indicate the data from IL28B (T/T) subjects treated without 1(OH) vitamin D3. White boxes indicate the data from IL28B (T/T) subjects treated with 1(OH) vitamin D3. Black triangles indicate the data from IL28B (T/G or G/G) subjects treated without 1(OH) vitamin D3. Black lines indicate the data from the subjects treated with 1(OH) vitamin D3 (A). The effect of vitamin D3 on the expression of ISGs mRNA in the hepatocyte cell culture are shown (B). Huh-7 cells were treated with ethanol (control), 1(OH) vitamin D3 (1.0 µM) or 1,25(OH)2 vitamin D3 (1.0 µM) after transfection of poly IC (Sigma-Aldrich, St. Louis, MO) or in vitro transcribed JFH-1 full-length RNA. Cells were harvested 30 h after transfection, and the expression levels of Mx, IFI44 and IFIT1 mRNA were assessed by real-time PCR using TaqMan Gene Expression Master Mix (Applied Biosystems, Carlsbad, CA) and gene-specific primer and probe sets (TaqMan Gene Expression Assay; Applied Biosystems) in accordance with the manufacturer’s instructions. The expression levels of genes with or without vitamin D3 treatment were expressed by log fold increase of untreated Huh-7 cells.

References

    1. Alter MJ, Kruszon-Moran D, Nainan OV, McQuillan GM, Gao F, et al. (1999) The prevalence of hepatitis C virus infection in the United States, 1988 through 1994. N Engl J Med 341: 556–562. - PubMed
    1. Abu-Mouch S, Fireman Z, Jarchovsky J, Zeina AR, Assy N (2011) Vitamin D supplementation improves sustained virologic response in chronic hepatitis C (genotype 1)-naive patients. World J Gastroenterol 17: 5184–5190. - PMC - PubMed
    1. Bitetto D, Fabris C, Fornasiere E, Pipan C, Fumolo E, et al. (2011) Vitamin D supplementation improves response to antiviral treatment for recurrent hepatitis C. Transpl Int. 24: 43–50. - PubMed
    1. Bitetto D, Fattovich G, Fabris C, Ceriani E, Falleti E, et al. (2011) Complementary role of vitamin D deficiency and the interleukin-28B rs12979860 C/T polymorphism in predicting antiviral response in chronic hepatitis C. Hepatology. 53: 1118–1126. - PubMed
    1. Petta S, Ferraro D, Camma C, Cabibi D, Di Cristina A, et al. (2012) Vitamin D levels and IL28B polymorphisms are related to rapid virological response to standard of care in genotype 1 chronic hepatitis C. Antiviral therapy. 17: 823–831. - PubMed

Publication types

MeSH terms

LinkOut - more resources