. 2013 May 22;8(5):e63925.
doi: 10.1371/journal.pone.0063925. Print 2013.

Comprehensive functional annotation of seventy-one breast cancer risk Loci

Affiliations

Comprehensive functional annotation of seventy-one breast cancer risk Loci

Suhn Kyong Rhie et al. PLoS One. .

Abstract

Breast Cancer (BCa) genome-wide association studies revealed allelic frequency differences between cases and controls at index single nucleotide polymorphisms (SNPs). To date, 71 loci have thus been identified and replicated. More than 320,000 SNPs at these loci define BCa risk due to linkage disequilibrium (LD). We propose that BCa risk resides in a subgroup of SNPs that functionally affects breast biology. Such a shortlist will aid in framing hypotheses to prioritize a manageable number of likely disease-causing SNPs. We extracted all the SNPs, residing in 1 Mb windows around breast cancer risk index SNP from the 1000 genomes project to find correlated SNPs. We used FunciSNP, an R/Bioconductor package developed in-house, to identify potentially functional SNPs at 71 risk loci by coinciding them with chromatin biofeatures. We identified 1,005 SNPs in LD with the index SNPs (r(2)≥0.5) in three categories; 21 in exons of 18 genes, 76 in transcription start site (TSS) regions of 25 genes, and 921 in enhancers. Thirteen SNPs were found in more than one category. We found two correlated and predicted non-benign coding variants (rs8100241 in exon 2 and rs8108174 in exon 3) of the gene, ANKLE1. Most putative functional LD SNPs, however, were found in either epigenetically defined enhancers or in gene TSS regions. Fifty-five percent of these non-coding SNPs are likely functional, since they affect response element (RE) sequences of transcription factors. Functionality of these SNPs was assessed by expression quantitative trait loci (eQTL) analysis and allele-specific enhancer assays. Unbiased analyses of SNPs at BCa risk loci revealed new and overlooked mechanisms that may affect risk of the disease, thereby providing a valuable resource for follow-up studies.


Conflict of interest statement

Competing Interests: The authors have declared that no competing interests exist.

Figures

Figure 1
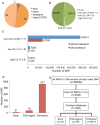
Figure 1. Identification of potential functional SNPs in 71 Breast cancer risk loci.
(A) Genomic distribution of 71 replicated index SNPs for breast cancer risk loci. (B) SNPs residing in 1 MB windows around breast cancer risk index SNPs were categorized into the indicated four different groups by measuring LD in EUR ethnic groups. (C) SNPs in each LD group were further analyzed by their locations coinciding with biofeatures. (D) High LD SNPs within biofeatures were categorized to three groups; exon, TSS region, and enhancers. (E) The entire process was summarized in a flow diagram.
Figure 2
Figure 2. 21 High LD SNPs in exon and effect of each variant to the respective protein.
(A) The list of high LD SNPs (r2≥0.5) in exons. The risk region number was derived from Table S1 and ordered by chromosome number. Index SNP of each corrSNP and the value of r2 between these SNPs were listed. The distance from the index SNP to each corrSNP was shown along with the name of the nearest gene. The type of each exon variant was also annotated. (B) A genomic browser view of two high LD SNPs, rs8100241 and rs8108174. The first track showed FunciSNP results for the exons. The name of the correlated SNP (rsnumber – r2 value) was shown in blue. The index SNP was shown in black. The bottom tracks were biofeature tracks, RefSeq genes/mRNA/Pseudogene tracks from UCSC Genes, common SNPs (version 137), and Linkage Disequilibrium (LD) blocks. LD block, which was measured by r2 value in phased CEU is shown. Allele frequencies of each SNP (in all populations) and zoomed in view of the genome browser for each SNP were shown, including the amino acid changes by missense variants. (C) The effect of amino acid changes by missense variants of the respective protein was predicted by SIFT and PolyPhen , .
Figure 3
Figure 3. An example of TSS regional SNPs, rs2303696, in the promoter region of ISYNA1.
The genomic browser view was shown of a TSS regional high LD SNP, rs2303696. First track shows FunciSNP results for TSS region. The name of correlated SNP (rsnumber – r2 value) was shown and color-coded to indicate the number of biofeatures (Fig. S3A). The index SNP was shown in black. The bottom tracks were biofeature tracks, RefSeq genes/mRNA/Pseudogene tracks from UCSC Genes, common SNPs (version 137), and Linkage Disequilibrium (LD) blocks. LD block, which was measured by r2 value in phased CEU is shown. Allele frequencies of rs2303696 (in all populations) and the location of this SNP in SP1 RE were shown.
Figure 4
Figure 4. Novel enhancers including high LD SNPs were identified in breast epithelial cells.
(A) Eleven enhancer regions, which included FunciSNP identified BCa high LD SNPs in epigenetically defined enhancers, were cloned and analyzed using the dual luciferase assays in MCF7 (blue), MDAMB231 (red), MCF10A (orange) and HMEC (blue). Each luciferase activity was divided by average luciferase activity of two negative controls, CT1 and 2. The average value of two negative controls was shown as a horizontal line across the breast cancer enhancers (BCEs) (gray). (B) The location of three SNPs (blue: rs4871782, green: rs28759353, black: rs10087810) at BCE5 and breast cancer risk tagSNP (red: rs13281615) in 8q24.21 region. (C) Allele-specific FAIRE assays were performed near three candidate SNPs for breast cancer risk at BCE5. Sequence results of Input DNA and FAIRE DNA are shown. The colors of the nucleotides from DNA sequencing: blue is C, green is A, black is G and red is T. Sequences near SNP were shown in a double-strand DNA (bottom). (D) Linkage Disequilibrium (LD) plot (r2) and haplotypes of three SNPs (in EUR) with breast cancer risk tagSNP, rs13281615 were shown . Allele-specific in vitro dual luciferase assays were performed in HMEC (E) and MDAMB231 cells (F). The Analysis of variance statistical test (ANOVA) was used to confirm the difference and two-side p-values between alleles were calculated using the student t-test.
Figure 5
Figure 5. An example of enhancer SNPs, rs76969790 likely alters a TAL1 response element.
The genomic browser view was shown of an enhancer SNP, rs2303696. First track showed FunciSNP results for enhancers. The name of correlated SNP (rsnumber – r2 value) was shown and color-coded to indicate the number of biofeatures (Fig. S3B). The index SNP was shown in black. The bottom tracks were biofeature tracks, RefSeq genes/mRNA/Pseudogene tracks from UCSC Genes, common SNPs (version 137), and Linkage Disequilibrium (LD) blocks. LD block, which was measured by r2 value in phased CEU is shown. Allele frequencies of rs76969790 (in all populations) and the location of this SNP in TAL1 RE are shown.
Figure 6
Figure 6. Interactions among breast cancer risk loci.
32 proteins coded by genes, which contained functional SNPs either in their exons or within their TSS regions plus the BRCA2, in which a nonsense index SNP resided, were laid out using subcellular localization annotation. Each molecule was shown in green hexagon. Interactions among these 33 genes/proteins were shown in green arrows (direct: solid line, indirect: dashed line). Each circle colored in yellow represents each TF. The interactions between the group, containing 33 genes/proteins and another group, containing top 18 TFs (yellow circle) that affected by high LD SNPs were shown in black arrows (direct: solid line, indirect: dashed line).

References

    1. Mavaddat N, Antoniou AC, Easton DF, Garcia-Closas M (2010) Genetic susceptibility to breast cancer. Molecular oncology 4: 174–191. - PMC - PubMed
    1. Peng S, Lu B, Ruan W, Zhu Y, Sheng H, et al. (2011) Genetic polymorphisms and breast cancer risk: evidence from meta-analyses, pooled analyses, and genome-wide association studies. Breast cancer research and treatment 127: 309–324. - PubMed
    1. Ahmed S, Thomas G, Ghoussaini M, Healey CS, Humphreys MK, et al. (2009) Newly discovered breast cancer susceptibility loci on 3p24 and 17q23.2. Nature genetics 41: 585–590. - PMC - PubMed
    1. Antoniou AC, Wang X, Fredericksen ZS, McGuffog L, Tarrell R, et al. (2010) A locus on 19p13 modifies risk of breast cancer in BRCA1 mutation carriers and is associated with hormone receptor-negative breast cancer in the general population. Nature genetics 42: 885–892. - PMC - PubMed
    1. Easton DF, Pooley KA, Dunning AM, Pharoah PD, Thompson D, et al. (2007) Genome-wide association study identifies novel breast cancer susceptibility loci. Nature 447: 1087–1093. - PMC - PubMed

Publication types

MeSH terms