

Trends in amphibian occupancy in the United States
- PMID: 23717602
- PMCID: PMC3661441
- DOI: 10.1371/journal.pone.0064347
Trends in amphibian occupancy in the United States
Abstract
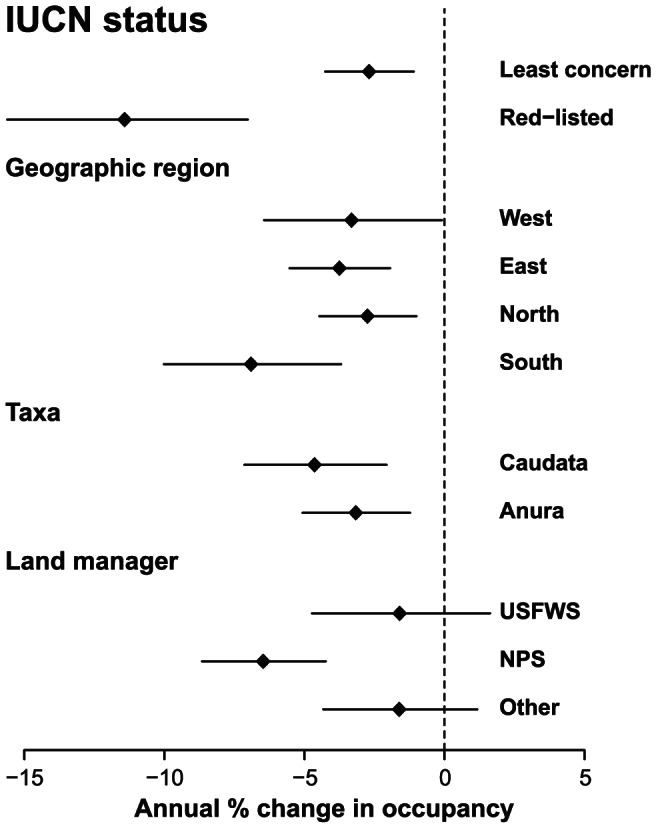
Though a third of amphibian species worldwide are thought to be imperiled, existing assessments simply categorize extinction risk, providing little information on the rate of population losses. We conducted the first analysis of the rate of change in the probability that amphibians occupy ponds and other comparable habitat features across the United States. We found that overall occupancy by amphibians declined 3.7% annually from 2002 to 2011. Species that are Red-listed by the International Union for Conservation of Nature (IUCN) declined an average of 11.6% annually. All subsets of data examined had a declining trend including species in the IUCN Least Concern category. This analysis suggests that amphibian declines may be more widespread and severe than previously realized.
Conflict of interest statement
Figures


References
-
- Wake DB (1991) Declining amphibian populations. Science 253: 860. - PubMed
-
- Wake DB (2012) Facing extinction in real time. Science 335: 1052–1053. - PubMed
-
- Stuart SN, Chanson JS, Cox NA, Young BE, Rodrigues ASL, et al. (2004) Status and trends of amphibian declines and extinctions worldwide. Science 306: 1783–1786. - PubMed
-
- McCallum ML (2007) Amphibian decline or extinction? Current declines dwarf background extinction rate. Journal of Herpetology 41: 483–491.
MeSH terms
LinkOut - more resources
Full Text Sources
Other Literature Sources
