

A new algorithm for integrated analysis of miRNA-mRNA interactions based on individual classification reveals insights into bladder cancer
- PMID: 23717626
- PMCID: PMC3663800
- DOI: 10.1371/journal.pone.0064543
A new algorithm for integrated analysis of miRNA-mRNA interactions based on individual classification reveals insights into bladder cancer
Abstract
Background: MicroRNAs (miRNAs) are small non-coding RNAs that regulate gene expression. It has been proposed that miRNAs play an important role in cancer development and progression. Their ability to affect multiple gene pathways by targeting various mRNAs makes them an interesting class of regulators.
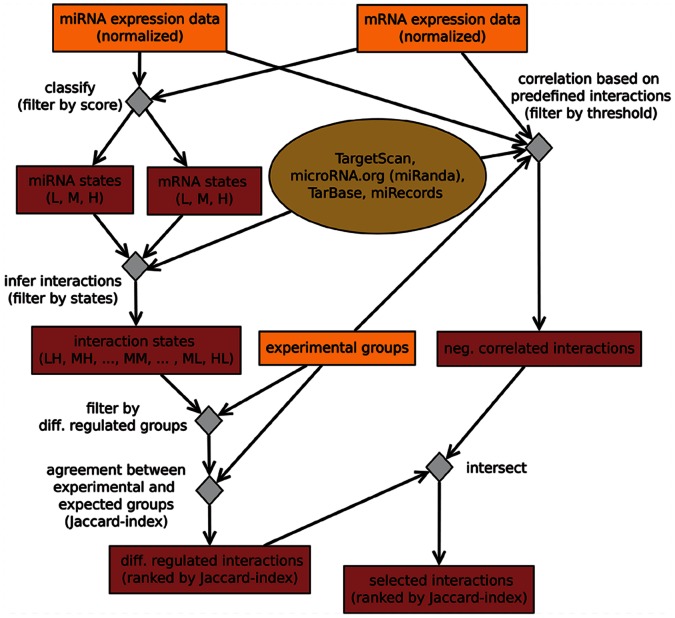
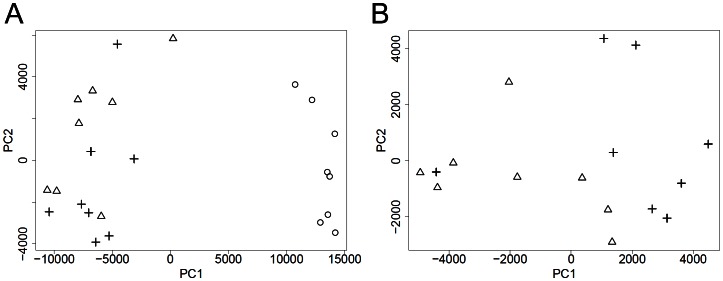
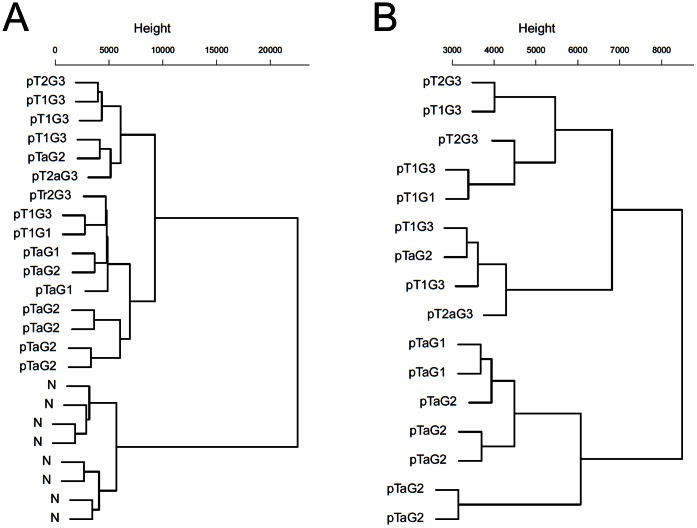
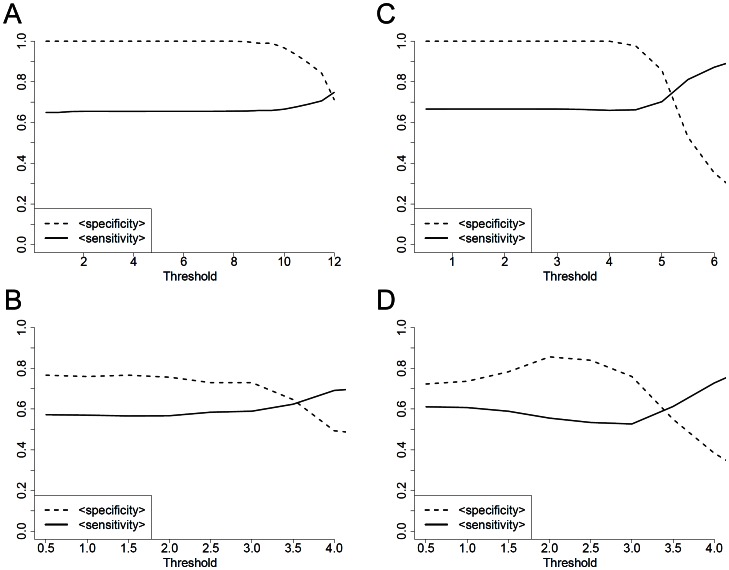
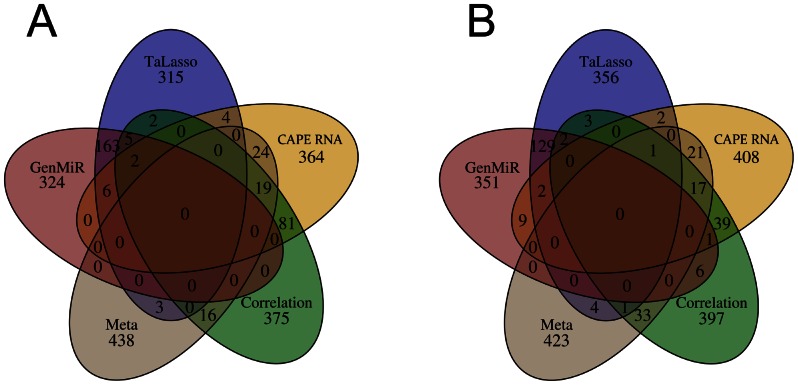
Methodology/principal findings: We have developed an algorithm, Classification based Analysis of Paired Expression data of RNA (CAPE RNA), which is capable of identifying altered miRNA-mRNA regulation between tissues samples that assigns interaction states to each sample without preexisting stratification of groups. The distribution of the assigned interaction states compared to given experimental groups is used to assess the quality of a predicted interaction. We demonstrate the applicability of our approach by analyzing urothelial carcinoma and normal bladder tissue samples derived from 24 patients. Using our approach, normal and tumor tissue samples as well as different stages of tumor progression were successfully stratified. Also, our results suggest interesting differentially regulated miRNA-mRNA interactions associated with bladder tumor progression.
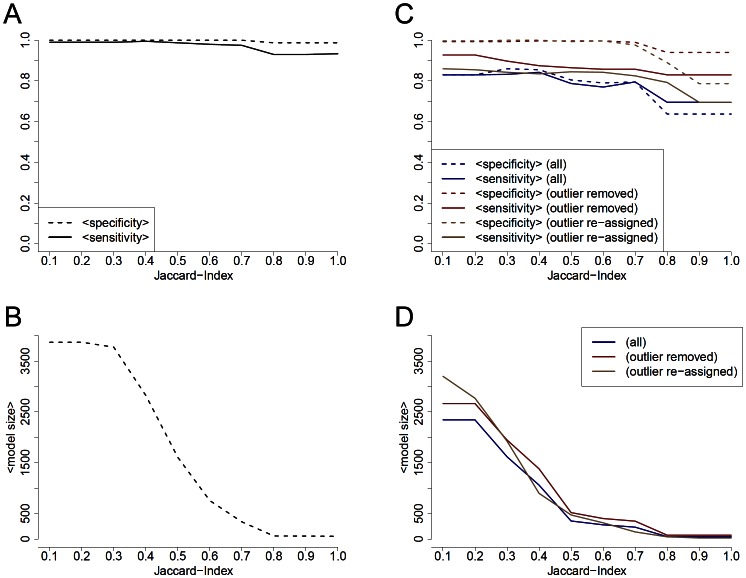
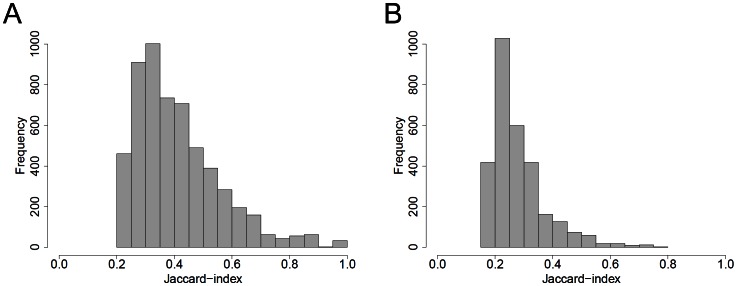
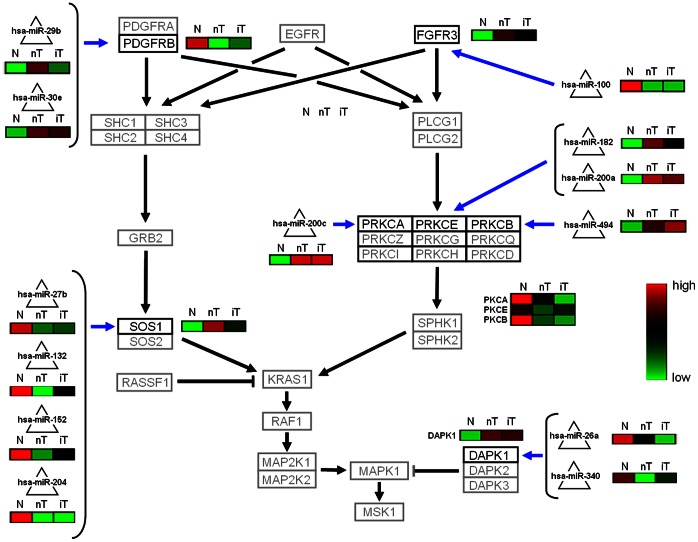
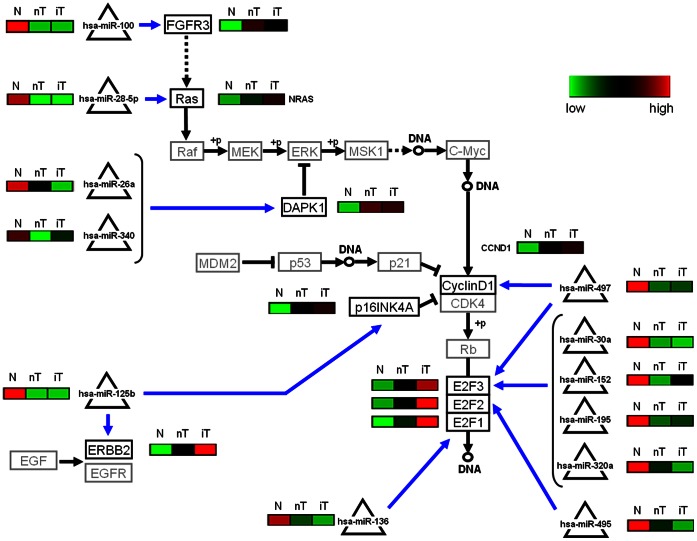
Conclusions/significance: The need for tools that allow an integrative analysis of microRNA and mRNA expression data has been addressed. With this study, we provide an algorithm that emphasizes on the distribution of samples to rank differentially regulated miRNA-mRNA interactions. This is a new point of view compared to current approaches. From bootstrapping analysis, our ranking yields features that build strong classifiers. Further analysis reveals genes identified as differentially regulated by miRNAs to be enriched in cancer pathways, thus suggesting biologically interesting interactions.
Conflict of interest statement
Figures
Similar articles
-
Modeling microRNA-mRNA interactions using PLS regression in human colon cancer.BMC Med Genomics. 2011 May 19;4:44. doi: 10.1186/1755-8794-4-44. BMC Med Genomics. 2011. PMID: 21595958 Free PMC article.
-
Screening biomarkers of bladder cancer using combined miRNA and mRNA microarray analysis.Mol Med Rep. 2015 Aug;12(2):3170-6. doi: 10.3892/mmr.2015.3739. Epub 2015 May 7. Mol Med Rep. 2015. PMID: 25955758
-
Comparative analysis of miRNA-mRNA interaction prediction tools based on experimental head and neck cancer data.Einstein (Sao Paulo). 2025 Apr 18;23:eAO1372. doi: 10.31744/einstein_journal/2025AO1372. eCollection 2025. Einstein (Sao Paulo). 2025. PMID: 40266039 Free PMC article.
-
Aberrant expression of microRNAs in bladder cancer.Nat Rev Urol. 2013 Jul;10(7):396-404. doi: 10.1038/nrurol.2013.113. Epub 2013 May 28. Nat Rev Urol. 2013. PMID: 23712207 Review.
-
A review on methods for predicting miRNA-mRNA regulatory modules.J Integr Bioinform. 2022 Apr 1;19(3):20200048. doi: 10.1515/jib-2020-0048. eCollection 2022 Sep 1. J Integr Bioinform. 2022. PMID: 35357793 Free PMC article. Review.
Cited by
-
Multifaceted enrichment analysis of RNA-RNA crosstalk reveals cooperating micro-societies in human colorectal cancer.Nucleic Acids Res. 2016 May 19;44(9):4025-36. doi: 10.1093/nar/gkw245. Epub 2016 Apr 11. Nucleic Acids Res. 2016. PMID: 27067546 Free PMC article.
-
Mevalonate pathway inhibition reduces bladder cancer metastasis by modulating RhoB protein stability and integrin β1 localization.Commun Biol. 2024 Nov 9;7(1):1476. doi: 10.1038/s42003-024-07067-8. Commun Biol. 2024. PMID: 39521858 Free PMC article.
-
miRGTF-net: Integrative miRNA-gene-TF network analysis reveals key drivers of breast cancer recurrence.PLoS One. 2021 Apr 14;16(4):e0249424. doi: 10.1371/journal.pone.0249424. eCollection 2021. PLoS One. 2021. PMID: 33852600 Free PMC article.
-
CDH1 overexpression predicts bladder cancer from early stage and inversely correlates with immune infiltration.BMC Urol. 2022 Sep 21;22(1):156. doi: 10.1186/s12894-022-01103-7. BMC Urol. 2022. PMID: 36131343 Free PMC article.
-
Analysing miRNA-Target Gene Networks in Inflammatory Bowel Disease and Other Complex Diseases Using Transcriptomic Data.Genes (Basel). 2022 Feb 18;13(2):370. doi: 10.3390/genes13020370. Genes (Basel). 2022. PMID: 35205414 Free PMC article.
References
-
- Siegel R, Naishadham D, Jemal A (2012) Cancer statistics, 2012. CA Cancer J Clin 62: 10–29. - PubMed
-
- Messing EM (2002) Urothelial tumors of the urinary tract. Campbell's Urology. 8 ed. Philadelphia: Saunders. 2732–2784.
-
- Hernandez S, de Muga S, Agell L, Juanpere N, Esgueva R, et al. (2009) FGFR3 mutations in prostate cancer: association with low-grade tumors. Mod Pathol 22: 848–856. - PubMed
-
- Miyao N, Tsai YC, Lerner SP, Olumi AF, Spruck CH, 3rd, et al (1993) Role of chromosome 9 in human bladder cancer. Cancer Res 53: 4066–4070. - PubMed
Publication types
MeSH terms
Substances
LinkOut - more resources
Full Text Sources
Other Literature Sources
Medical
Molecular Biology Databases
