. 2013 May 22;78(4):583-95.
doi: 10.1016/j.neuron.2013.05.006.

Mapping and cracking sensorimotor circuits in genetic model organisms

Affiliations

Mapping and cracking sensorimotor circuits in genetic model organisms

Damon A Clark et al. Neuron. .

Abstract

One central goal of systems neuroscience is to understand how neural circuits implement the computations that link sensory inputs to behavior. Work combining electrophysiological and imaging-based approaches to measure neural activity with pharmacological and electrophysiological manipulations has provided fundamental insights. More recently, genetic approaches have been used to monitor and manipulate neural activity, opening up new experimental opportunities and challenges. Here, we discuss issues associated with applying genetic approaches to circuit dissection in sensorimotor transformations, outlining important considerations for experimental design and considering how modeling can complement experimental approaches.


Figures

Figure 1
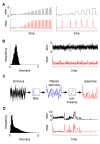
Figure 1
Probing a system with different stimuli. (A) Examples of pulse and step changes in stimuli (top) and simulated responses (bottom). (B) A Gaussian stimulus. The left plot shows the distribution of Gaussian stimulus values (with mean 1), while the right plots show a Gaussian noise stimulus (top) and a simulated sample response (bottom). (C) Explanation of the LN model. In the model, stimuli (left trace) are first passed over with a linear filter to produce a weighted average of the stimulus (middle trace). That filtered stimulus is mapped onto the response (right trace) with a function that may contain non-linearities. The filter can be estimated from the system response to a Gaussian noise input, after which the mapping function can be fit to the data. The function is linear in the case of the linear system, or can account for post-filtering non-linearities that occur quickly compared to the filtering process, for instance to prevent very strong responses (create saturation) or to prevent negative responses (create rectification). (D) A natural stimulus (from (Van Hateren, 1997)). In the distribution on the left, note the infrequent but large stimulus values (the mean is set to 1). A natural time series of that distribution, incorporating naturalistic dynamics (top), along with a simulated sample response to that stimulus (bottom).
Figure 2
Figure 2
Different levels of behavioral metrics. (A) Tactic behaviors cause animals to migrate up or down gradients of some environmental cue. Here we examine the case of tracking C. elegans to measure a tactic behavior. The top triangle represents a gradient in stimulus magnitude, and each dot in the field below represents an instantaneous center of mass position of a worm in the gradient. On this scale, dot diameters are roughly the size of the worm. (B) In steady state, the distribution of worm positions over the gradient can be measured as an index or as a full distribution. Such measurements can also be made over time, incorporating transient changes in distribution. (C) At a finer scale, each worm’s track can be reconstructed in order to extract out the statistics of the worm’s coarse movements, including speed, heading, and, for instance, turning events. Turns are marked in red, gray dots represent early locations, black later locations, and the bar represents a worm’s body length. The integration over time of relevant statistics at this level should result in the distribution measured in (B). (D) More finely still, the shape of the worm’s bending over time can be analyzed to extract patterns in muscle activation. These patterns must ultimately result in the statistics in (C) and the distribution in (B).
Figure 3
Figure 3
Circuit manipulation. (A) Cartoon of a simple, intact circuit. The purple cell simply sums the synaptic input from the red and blue cells. (B) Illustration of a simply interpretable silencing outcome. When the blue cell is silenced, the purple cell now simply reports the red cell’s activity. The entire system is linear in this case. (C) Illustration of dynamic range confounding interpretation. In this case, when the blue cell is silenced, the lack of a tonic blue input moves the purple cell below its natural dynamic range, clipping the remaining input. This is the equivalent of putting a nonlinearity g(.) on the summation of the inputs. The linear case is shown in light purple for comparison. (D) Illustration of feedback gain confounding interpretation. In this case, the inputs are summed, but the purple cell provides negative feedback on the gain from the red and blue cells. When the blue cell is silenced, the gain on the red synapse is increased to accommodate the lesser total input. The linear case is shown in light purple for comparison. Cases (C) and (D) illustrate complications to interpreting silencing experiments in even very simple circuits; similar caveats will apply to activation experiments.
Figure 4
Figure 4
A hierarchy of levels of understanding neural computation. Modeling, detailed behavioral analysis, stimulus selection, neural manipulations, and neural measurements feed into understanding at all these levels. Moving up through the hierarchy, one goal is to connect the broader description to the low-level details. Moving down through the hierarchy, one goal is to use the broader descriptions to suggest mechanisms or constraints that might be sought in the lower levels.

References

    1. Ahrens MB, Li JM, Orger MB, Robson DN, Schier AF, Engert F, Portugues R. Brain-wide neuronal dynamics during motor adaptation in zebrafish. Nature. 2012;485:471–477. - PMC - PubMed
    1. Alivisatos AP, Chun M, Church GM, Deisseroth K, Donoghue JP, Greenspan RJ, McEuen PL, Roukes ML, Sejnowski TJ, Weiss PS. The Brain Activity Map. Science. 2013;339:1284–1285. - PMC - PubMed
    1. Andermann ML, Kerlin AM, Roumis DK, Glickfeld LL, Reid RC. Functional Specialization of Mouse Higher Visual Cortical Areas. Neuron. 2011;72:1025–1039. - PMC - PubMed
    1. Aptekar JW, Shoemaker PA, Frye MA. Figure Tracking by Flies Is Supported by Parallel Visual Streams. Current Biology. 2012;22:482–487. - PubMed
    1. Arshavsky VY, Burns ME. Photoreceptor signaling: supporting vision across a wide range of light intensities. Journal of Biological Chemistry. 2012;287:1620–1626. - PMC - PubMed

Publication types

Substances

LinkOut - more resources