. 2013 May 22;78(4):615-22.
doi: 10.1016/j.neuron.2013.03.009.

Nanoscale scaffolding domains within the postsynaptic density concentrate synaptic AMPA receptors

Affiliations

Nanoscale scaffolding domains within the postsynaptic density concentrate synaptic AMPA receptors

Harold D MacGillavry et al. Neuron. .

Abstract

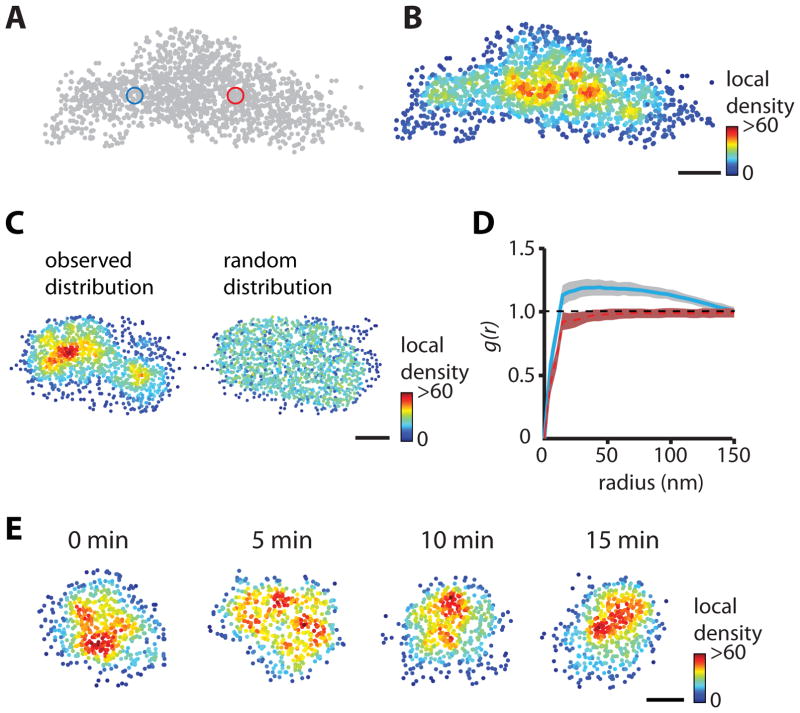
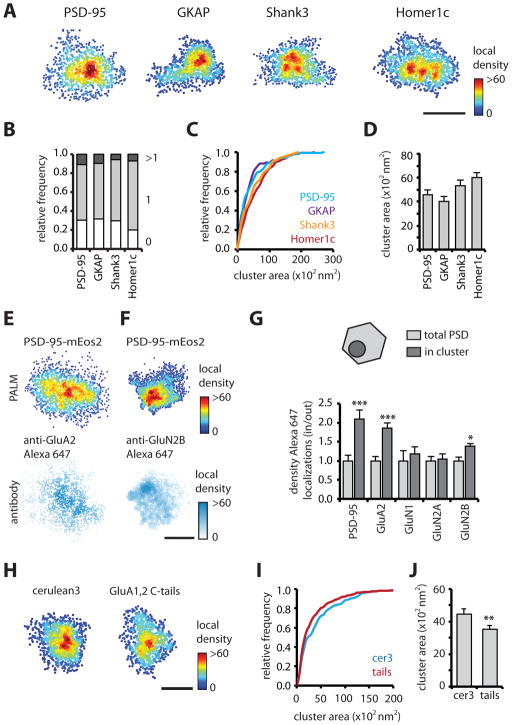
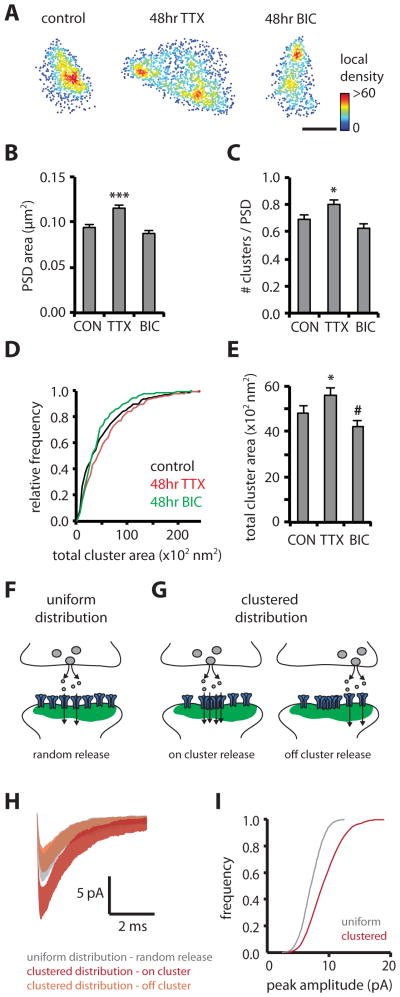
Scaffolding molecules at the postsynaptic membrane form the foundation of excitatory synaptic transmission by establishing the architecture of the postsynaptic density (PSD), but the small size of the synapse has precluded measurement of PSD organization in live cells. We measured the internal structure of the PSD in live neurons at approximately 25 nm resolution using photoactivated localization microscopy (PALM). We found that four major PSD scaffold proteins were each organized in distinctive ∼80 nm ensembles able to undergo striking changes over time. Bidirectional PALM and single-molecule immunolabeling showed that dense nanodomains of PSD-95 were preferentially enriched in AMPA receptors more than NMDA receptors. Chronic suppression of activity triggered changes in PSD interior architecture that may help amplify synaptic plasticity. The observed clustered architecture of the PSD controlled the amplitude and variance of simulated postsynaptic currents, suggesting several ways in which PSD interior organization may regulate the strength and plasticity of neurotransmission.


Figures

Figure 1
Figure 1. Super-resolution imaging of the postsynaptic density
(A) Oblique illumination of SEP-GluA1 marking synapses along a stretch of dendrite. 100 nm pixels. (B) Same region, PALM image of shrPSD-95-mEos2. 25 nm pixels. Scale bar, 500 nm. (C) Single-molecule localizations of PSD-95-PAtagRFP PALM (red) superimposed upon the widefield image of SEP-GluA1 fluorescence (white). Scale bars, 1 μm (left) and 500 nm (right). (D–E) Histograms of number of detected photons per molecule (D), and localization precision (E). (F) Histogram of effective resolution calculated from the localization precision and density of shrPSD-95-mEos2 molecules in individual PSDs. (G) Cumulative distribution of PSD area measured by PALM for mEos2-tagged shrPSD-95 and shrShank3 compared with confocal microscopy of neurons expressing shrPSD-95-GFP. (H) Boxplot summary of PSD area measured by PALM for shrPSD-95 and shrShank3, compared with confocal, mean PSD area based on published EM data (see text), and PALM on neurons overexpressing GKAP, Shank3 or Homer1c. **, p < 0.01, Kruskal-Wallis. (I) Comparison of summed oblique illumination (top) and PALM image (bottom) of shrPSD-95-mEos2. Arrowheads mark PSDs expanded at right. Pixel size 25 nm, left; 12 nm, right. Scale bar, 2.5 μm left, 200 nm right.
Figure 2
Figure 2. Heterogeneous distribution of scaffold molecules within the postsynaptic density
(A–B) Single-molecule localization of PSD-95-Eos2. Individual molecules were color-coded according to their local density, the number of molecules within a radius five times the average nearest neighbor distance within the PSD (blue and red circles). Scale bar, 100 nm. (C) Homogenous distribution (right) generated by randomly sampling equal numbers of localizations as observed (left). Scale bar, 100 nm. (D) Mean pair-correlation function of the PSD in (C) for the measured particle locations (blue) and for the simulated locations (red). Shaded areas represent 99% confidence intervals calculated from the randomized ensembles, showing significant departures from homogeneity. (E) Example of a time series of shrPSD-95-mEos2 local density plots, revealing time-dependent variation in the distribution of PSD-95 molecules within the PSD. Scale bar, 100 nm.
Figure 3
Figure 3. Scaffold organization in subsynaptic clusters enriched in AMPARs
(A) Examples of PSDs resolved with PALM for mEos2-tagged shrPSD-95, GKAP, shrShank3 and Homer1c. Scale bar, 200 nm. (B) Relative frequency of PSDs with 0, 1, or more clusters. (C–D) Cumulative frequency distribution and mean of cluster area for different scaffold molecules. (E–F) Examples of two-color single-molecule imaging for shrPSD-95-mEos2 and GluA2 or GluN2B. Scale bar, 200 nm. (G) Relative enrichment of PSD-95, GluA2, GluN1, GluN2A and GluN2B localizations in and outside of subsynaptic PSD-95 clusters. Alexa647 localizations within the PSD defined by PSD-95-mEos2 (polygonal) were extracted, and the densities in and out of the subdomain (circle) were compared. ***, p < 0.001, *, p < 0.05, two-way ANOVA with Bonferroni post-hoc test. (H) Examples of PSDs resolved with PALM in cerulean3 or GluA1,2 C-tail expressing neurons. (I–J) Cumulative frequency distribution and mean of cluster area for control (cer3) and GluA1,2 C-tail (tails) expressing neurons. **, different from control, p < 0.01, Kolmogorov-Smirnov test.
Figure 4
Figure 4. Subsynaptic structure is altered by synaptic activity and shapes postsynaptic responses
(A) Examples of PSDs resolved with PALM comparing a control PSD with PSDs after chronic treatment with TTX or bicuculline (BIC). Scale bar, 200 nm. (B) Mean PSD area for control, TTX and BIC treatment. ***, p < 0.001, Kruskal-Wallis. (C) Mean number of clusters per PSD for control, TTX and BIC. *, p < 0.05, one-way ANOVA. (D–E) Cumulative frequency distribution and mean of total cluster area for control, TTX and BIC. *, different from control, p < 0.05, #, p < 0.1, K-S test. (F–G) Postsynaptic currents were simulated assuming randomly positioned release events on a uniform distribution of AMPARs (F), compared with release on and outside of a subsynaptic cluster of the AMPAR distribution measured in Figure 3E (G). (H) Average mEPSC trace ± standard deviation of 50 runs for uniform distribution with random release locations compared with on and off cluster release for the clustered distribution. (I) Cumulative frequency distribution of peak amplitude for simulated mEPSCs comparing randomly positioned release events (50 runs/location, 50 locations) on a uniform or clustered distribution of AMPARs.

References

    1. Bats C, Groc L, Choquet D. The interaction between Stargazin and PSD-95 regulates AMPA receptor surface trafficking. Neuron. 2007;53:719–734. - PubMed
    1. Betzig E, Patterson G, Sougrat R, Lindwasser O, Olenych S, Bonifacino J, Davidson M, Lippincott-Schwartz J, Hess H. Imaging intracellular fluorescent proteins at nanometer resolution. Science. 2006;313:1642–1645. - PubMed
    1. Blanpied TA, Kerr JM, Ehlers MD. Structural plasticity with preserved topology in the postsynaptic protein network. Proc Natl Acad Sci U S A. 2008;105:12587–12592. - PMC - PubMed
    1. Blanpied TA, Scott DB, Ehlers MD. Dynamics and regulation of clathrin coats at specialized endocytic zones of dendrites and spines. Neuron. 2002;36:435–449. - PubMed
    1. Burette AC, Lesperance T, Crum J, Martone M, Volkmann N, Ellisman MH, Weinberg RJ. Electron tomographic analysis of synaptic ultrastructure. J Comp Neurol. 2012;520:2697–2711. - PMC - PubMed

Publication types

MeSH terms

Substances