

Review
doi: 10.1016/j.clp.2013.02.007.
Optical coherence tomography in retinopathy of prematurity: looking beyond the vessels
Affiliations
- PMID: 23719310
- PMCID: PMC3947541
- DOI: 10.1016/j.clp.2013.02.007
Item in Clipboard
Review
Optical coherence tomography in retinopathy of prematurity: looking beyond the vessels
Clin Perinatol.
2013 Jun.
Abstract
Retinopathy of Prematurity (ROP) is a leading cause of childhood blindness in the United States. Optical Coherence Tomography (OCT) is a relatively new imaging technology capable of imaging ocular structures in cross section at high resolution. We present an age-customized approach to perform Spectral Domain OCT in neonates and infants, and from SDOCT, the in-vivo development of the human fovea during the premature period up through term birth along with retinal changes unique to premature infants with ROP. Finally, we explore how this novel information may affect our understanding of ROP and the possible implications in vision and retinal development.
Copyright © 2013 Elsevier Inc. All rights reserved.
Figures
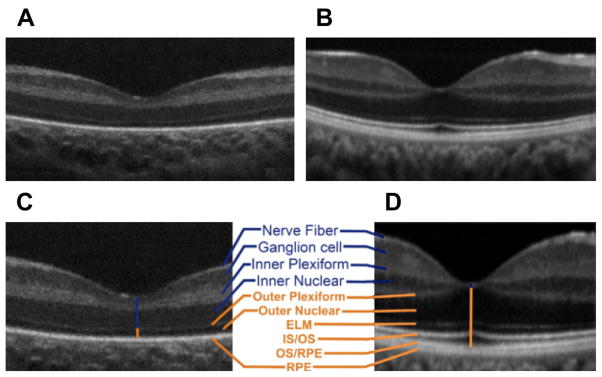
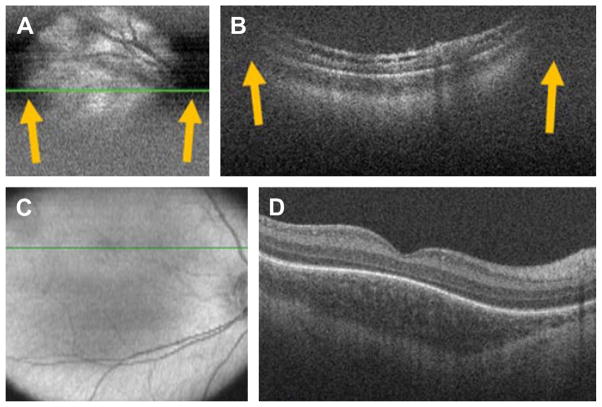
Infant versus adult retinal layers differences visualized by SDOCT. Summed SDOCT B-scans at the fovea. (A) From a 31-week-old PMA premature infant (born at 27 weeks PMA, birth weight 1205 g, ROP zone II, stage 2) and (B) from a 23-year-old adult born at term. (C, D) are magnified images of (A, B), respectively, to show retinal layers in better detail. From inner (top) to outer (bottom), the layers are nerve fiber layer, ganglion cell layer (GCL), inner plexiform layer (IPL), inner nuclear layer (INL), outer plexiform layer (OPL), outer nuclear layer, external limiting membrane, inner segment (IS) to outer segment (OS), photo-receptor OS, and retinal pigment epithelium (RPE) microvilli, and RPE. Note that the thick IRLs of the neonate (blue upper vertical line, layers listed in blue) correspond to thin condensed corresponding layers in the adult and that the thin outer retinal layers of the neonate (orange lower vertical line) became thicker layers in the adult eye (listed in orange; external limiting membrane [ELM], IS/OS, and OS/RPE were not present in the premature fovea). (From Maldonado RS, O’Connell RV, Sarin N, et al. Dynamics of human foveal development after premature birth. Ophthalmology 2011;118(12):2316; with permission.)
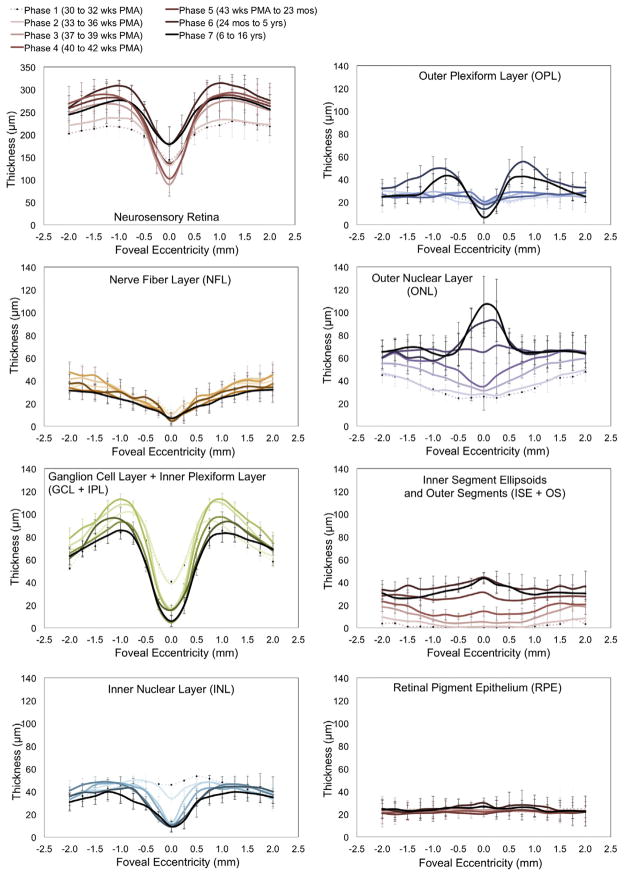
Retinal layer thickness redistribution during foveal development quantified by SDOCT image segmentation. Mean retinal layer thicknesses are represented from 30 weeks PMA to 16 years. Premature infants are in phases 1 and 2, phases 3 and 4 include term birth, and children are in phases 5 to 7. The youngest age group (phase 1) is represented by a pale dotted line with increasing color intensity up to the oldest (phase 7), a black line. Standard deviations are plotted as error bars. This figure shows a centrifugal redistribution of inner retinal layers (box plots on the left) and centripetal growth at the photoreceptor layers (box plots on the right). From Vajzovic L, Hendrickson AE, O’Connell RV, et al. Maturation of the human fovea: correlation of spectral-domain optical coherence tomography with histology. Am J Ophthalmol 2012;154(5):782; with permission.
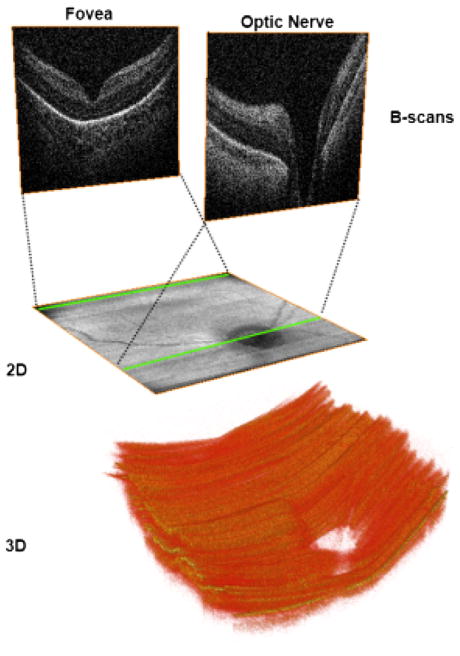
Two-dimensional (2D) and three-dimensional (3D) images obtained from volumetric SDOCT scans from a 31-week-old PMA infant. Volumetric 6 × 6 mm SDOCT scan from a 31-week-old PMA infant. Sixty B-scans were acquired in less than 4 seconds, with minimal motion detected during acquisition. The foveal and optic nerve B-scans are shown in the top of the figure. By collapsing axially all the pixels from each B-scan, a 2 fundus image (middle) comparable with a fundus photo can be obtained. Using volume rendering software, a 3D reconstruction was achieved (bottom), showing the optic nerve cup and the retinal surface contour.
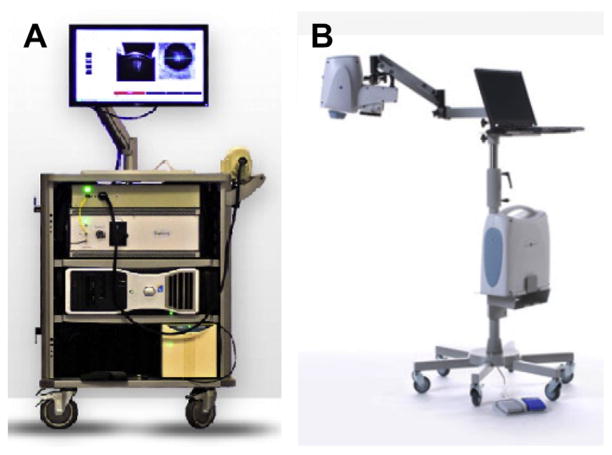
Commercially available portable SDOCT systems useful for supine imaging. (A) Bioptigen Envisu system. 0.9-kg (2-pound) handheld scanner. Speed of 32,000 A-scans per second and 3.3-μm axial resolution for handheld imaging of premature infants to adults. (B) Optovue iStand system with a 2.3-kg (5-pound) head scanner supported by an articulating arm, with live en face image for targeting. Speed of 26,000 A-scans per second and a 5-μm axial resolution for supine patient imaging. Product labeling in 2012 for the iVue system with the iStand does not mention pediatric use. (A: Courtesy of Bioptigen, Inc., Morrisville, NC; with permission; B: Courtesy of Optovue, Inc., Fremont, CA; with permission.)
SDOCT clipping correction and focus adjustment. (A, B) SDOCT scanning without age-customized protocol. Severe clipping artifacts (white arrows) on the two-dimensional retinal image (A) and on the B-scan (B) of a 38-week-old PMA infant are noted in addition to poor image quality. (C, D) Images were obtained after applying the age-customized protocol. Improved field of view in the retinal image (C) and on the B-scan (D) with improved image quality. The inner retina in (B) shows schisis in an eye with peripheral retinal detachment. The fovea in (D) shows persisting inner retinal layers in an older premature infant. (From Maldonado RS, Izatt JA, Sarin N, et al. Optimizing hand-held spectral-domain optical coherence tomography imaging for neonates, infants and children. Invest Ophthalmol Vis Sci 2010;51:2682; with permission.)

A-scan oversampling in infant retina. Because scan lengths set for an adult eye project as a shorter scan in the smaller infant eyes, the number of A-scans should be reduced to maintain the same A-scan spacing as in the adult standard eye. Most commercial SDOCT systems come with preset scans for adults, and the same settings should not be applied to infants. An ideal OCT system for infant imaging should provide the imager with the capability of modifying the number of A-scans as desired.
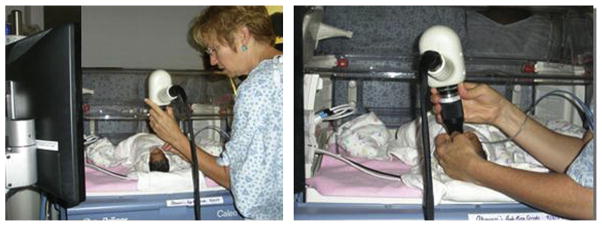
SDOCT imaging in the neonatal intensive care unit (NICU). Typical SDOCT imaging methodology in the NICU. With the infant lying comfortably in the crib (left), the imager gently opens the eyelids with the fingertips and holds the handheld SDOCT scanner over the infant’s eyes without touching the infant or the infant’s eye (right). The weight of the scanner is centered over the imager’s hand, and the distal tip of the lens system can be steadied by the fingers holding the eyelids. A second operator operates the software and captures the scans. The scanner and the infant’s head could be tilted or moved to acquire the area of interest.
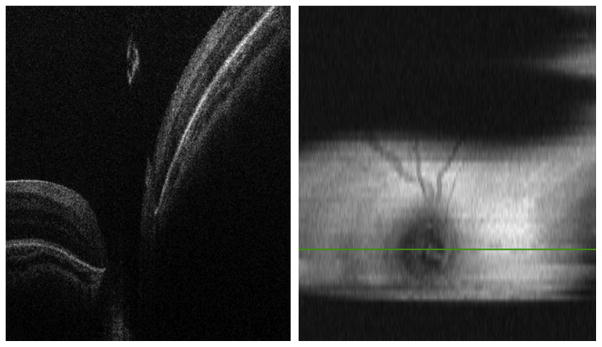
SDOCT image capturing in an infant with 3 mm pupil dilation. (Left) B-scan at the center of the optic nerve without clipping artifacts. (Right) Two-dimensional retinal image showing clipping artifacts caused by the pupil and imager/infant motion.
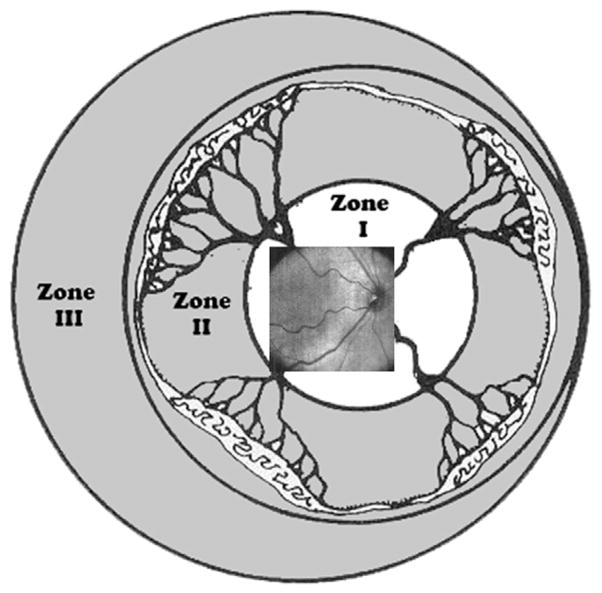
Retinal zone imaged by SDOCT. Field of view range of retinal imaging with the portable handheld SDOCT unit. This system provides high-magnification imaging within zone I and can only infrequently capture images at the anterior border of zone I/posterior border of zone II. (From Lee AC, Maldonado RS, Sarin N, et al. Macular features from spectral-domain optical coherence tomography as an adjunct to indirect ophthalmoscopy in retinopathy of prematurity. Retina 2011;31(8):1470–82; with permission.)
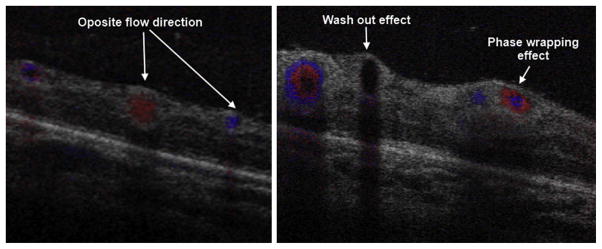
SDOCT color Doppler imaging in a 42-week-old PMA infant. The volumetric scan was of 5 × 5 mm, 500 A-scans/B-scan, 40 B-scans and 5 Doppler samples (5 repeated A-scans at each single A-scan point). The B-scans shown were located in zone I across the temporal/superior vascular arcades. (Left) B-scan distal to the optic nerve. Red and blue represent vascular flow in opposite directions with respect to the OCT beam. (Right) B-scan more proximal to the optic nerve. Red and blue rings are produced by increased flow velocity. At higher flow velocities, the Doppler signal disappears, a phenomenon known as washout effect.
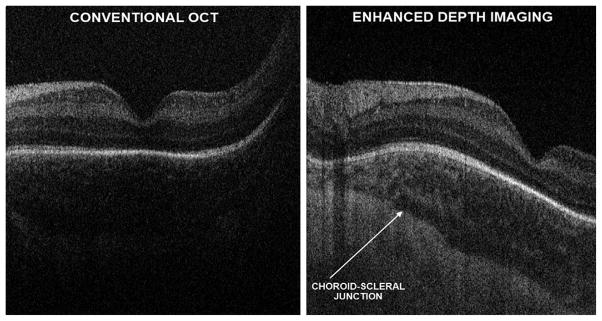
Research SDOCT imaging with and without EDI in a 38-week-old PMA infant. With conventional SDOCT, the choroid may not always be well visualized, as shown in left panel. Furthermore, the choroid-scleral junction boundary is not clearly defined in the image. On the same infant, using EDI, which does not change the SDOCT signal directed into the eye, but modifying settings for the null point (right), the choroid features could be better appreciated and the choroid-scleral junction well defined without losing resolution of the retinal layers.
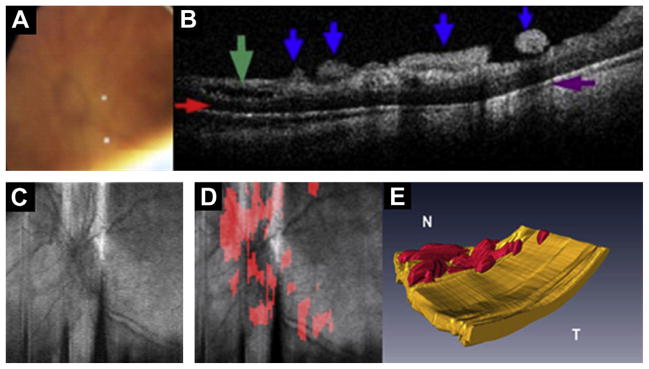
Preretinal fibrovascular tissue in aggressive posterior ROP. Images obtained from the left eye of a 23-week-old born infant imaged at 37 weeks PMA. (A) Video-indirect image of the optic nerve and posterior pole of the retina without evidence of preretinal structures. (B) SDOCT B-scan showing preretinal tissue (blue arrows), retinal schisis (green arrow), sub-retinal fluid (red arrow), and denote shadowing artifact from preretinal structures (purple arrow). (C) Retinal image of optic nerve and posterior pole. (D) Same retinal image in (C) with preretinal tissue localized (red areas in D) surrounding and overlying optic nerve. (E) Three-dimensional SDOCT image reconstruction depicts preretinal structures in the posterior pole consistent with preretinal fibrovascular tissue. (Modified from Chavala SH, Farsiu S, Maldonado R, et al. Insights into advanced retinopathy of prematurity using handheld spectral domain optical coherence tomography imaging. Ophthalmology 2009;116:2450; with permission.)
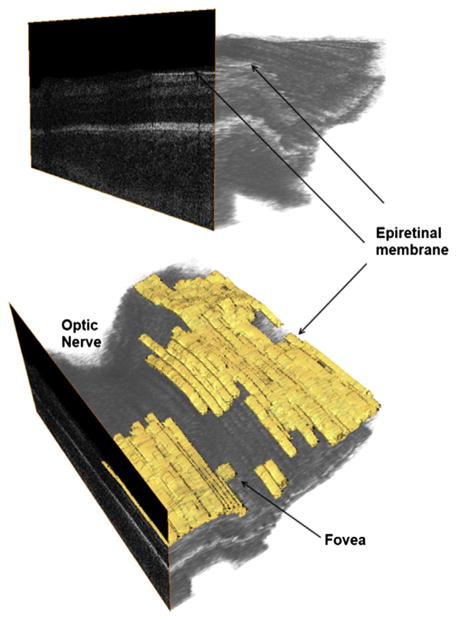
Epiretinal membrane (ERM) in a 37-week-old PMA infant. Epiretinal membranes are frequent in infants with ROP but appear as a very thin hyperreflective layer separated from the retina (top) in contrast to thicker membranes seen in macular pucker. The lower figure aids in localization of the ERM, which is parafoveal and away from the optic nerve.
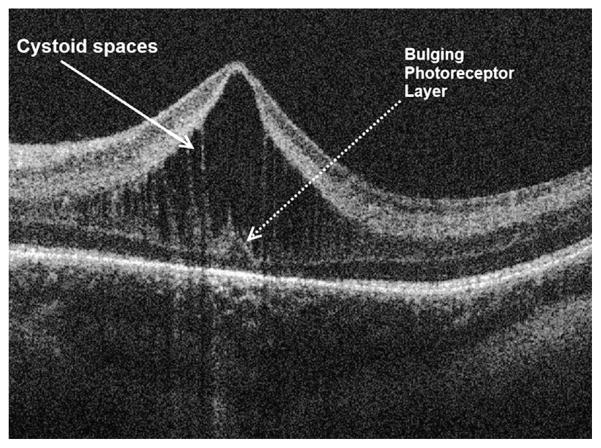
Macular edema of prematurity. SDOCT cross-sectional image at the foveal center in a 38-week-old PMA infant. Prominent cystoid spaces located exclusively at the inner nuclear layer are characteristic of MEOP. Frequently, these spaces are vertically elongated and deform the fovea. Note the photoreceptor layer central dome, which is not expected at this age of development.
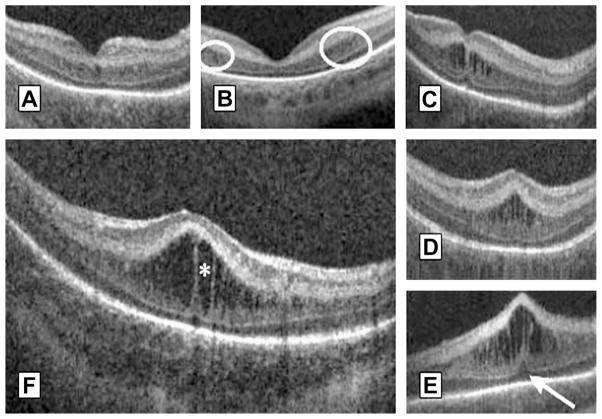
Morphologic characteristics and phenotypes of MEOP in 42 prematurely born infants ages 31 to 37 weeks PMA. Three CME phenotypes were observed in the patients: (A) single central; (B) Parafoveal (when cystoid structures were grouped around the foveal center as shown within the white encircled areas), and (C) multiple elongated cystoid structures when the parafoveal and central fovea contained cystoid structures. For the multiple elongated CME phenotype, severity was scored as mild (C) if the foveal pit was present; moderate (D) if the fovea was bulging but Photoreceptor layer (PRL) was not affected and severe (E) when the fovea and PRL had a bulging shape (white arrow). (F) Magnified SDOCT scan to show morphologic characteristics found in severe CME. White asterisk is located within a cystoid space. (From Maldonado RS, O’Connell R, Ascher SB, et al. Spectral-domain optical coherence tomographic assessment of severity of cystoid macular edema in retinopathy of prematurity. Arch Ophthalmol 2012;130(5):572; with permission.)
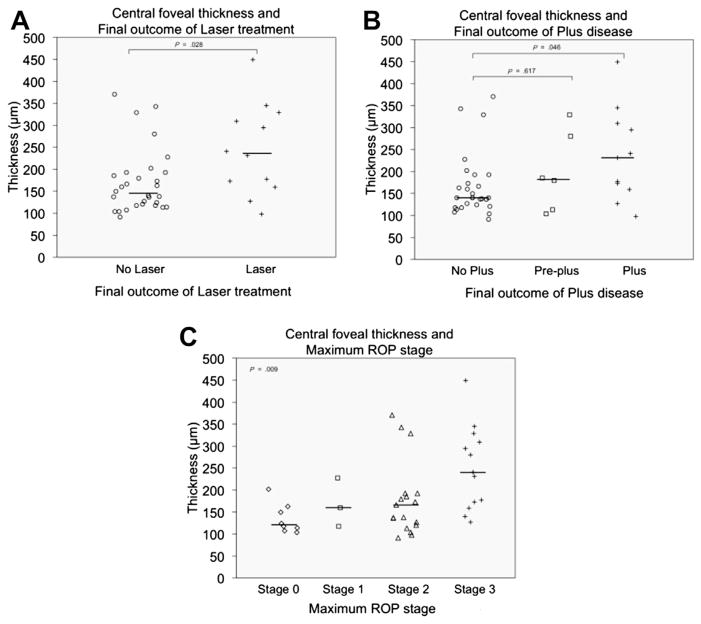
CFT data distribution in premature infants imaged before 37 weeks PMA by final ROP outcome. The median CFT was significantly greater in the laser group than in the non-laser group (A), in the plus disease group than in the normal vasculature group (B), and in maximum stage 3 group than in patients with stages 0, 1, or 2 (C). (From Maldonado RS, O’Connell R, Ascher SB, et al. Spectral-domain optical coherence tomographic assessment of severity of cystoid macular edema in retinopathy of prematurity. Arch Ophthalmol 2012;130(5):573; with permission.)
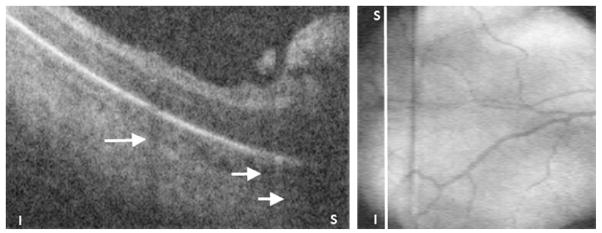
Preretinal tissue corresponding to ROP stage 3 in a 32-week-old PMA infant. (Left) SDOCT B-scan of the periphery of zone I. The ridge and likely neovascularization appear as an elevated preretinal mass separated from the retina in some segments. These preretinal tissue cast shadows (short white arrows) because of its vascular component similar to the shadowing from retinal vessels (longer white arrow). (Right) Corresponding retinal image showing the location of the B-scan from left panel (white line).
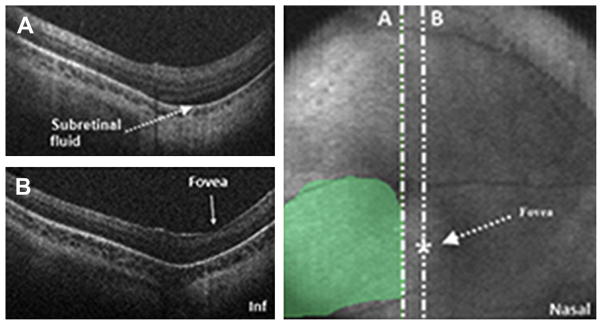
SDOCT value in determination of foveal involvement in cases of retinal detachment. SDOCT imaging session performed in an infant diagnosed with retinal detachment caused by ROP. A 6 × 6 volumetric SDOCT scan of 80 B-scans was captured. Subretinal fluid was detected (A) and confirmed the retinal detachment. The fovea had no subretinal fluid present (B). Subretinal fluid was traced over the retinal image for estimation of retinal detachment size and localization.
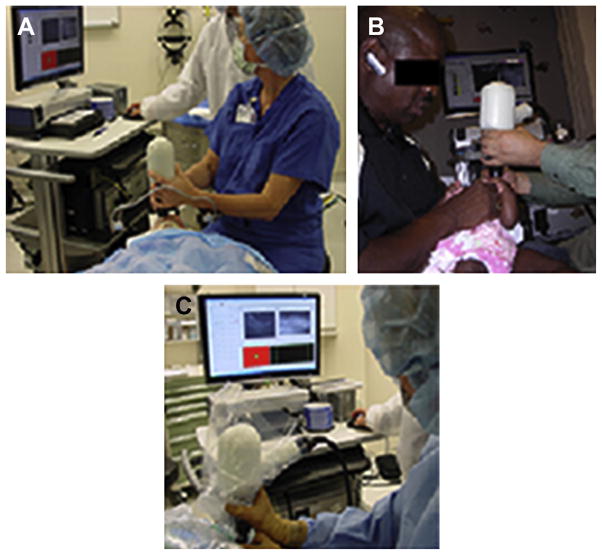
Application of portable SDOCT in different clinical scenarios. In addition to the application of SDOCT in the NICU for infants undergoing ROP screening, portable SDOCT technology has been used, and published data have contributed to understanding of diverse retinal disease in infants and children undergoing examination under anesthesia (A), in the ophthalmologic pediatric clinic (B), and intraoperatively (C).
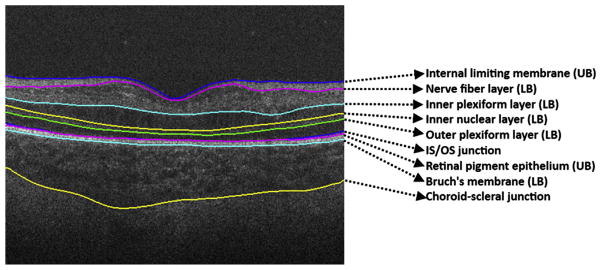
Retinal layer segmentation on pediatric scans. Retinal layer boundaries segmented by DOCTRAP software. Nine retinal boundaries are detected and from these, retinal layer thicknesses can be calculated automatically.
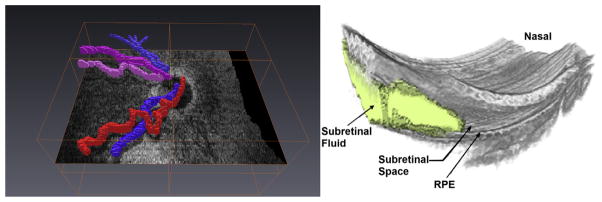
Three-dimensional reconstruction from SDOCT scans captured in infants. Retinal vessels segmented (left) show tortuosity and help in distinguishing arterioles from venules. Subretinal fluid, retinal elevation, and retinal contour visualized in 3 dimensions using manual segmentation of subretinal fluid.
References
-
- Wojtkowski M, Leitgeb R, Kowalczyk A, et al. In vivo human retinal imaging by Fourier domain optical coherence tomography. J Biomed Opt. 2002;7(3):457–63. - PubMed
-
- Yaqoob Z, Wu J, Yang C. Spectral domain optical coherence tomography: a better OCT imaging strategy. Biotechniques. 2005;39(Suppl 6):S6–13. - PubMed
-
- Liu B, Brezinski ME. Theoretical and practical considerations on detection performance of time domain, Fourier domain, and swept source optical coherence tomography. J Biomed Opt. 2012;12(4):044007. - PubMed
Publication types
MeSH terms
Grants and funding
LinkOut - more resources
Full Text Sources
Other Literature Sources
Medical
