Use of intensity quotients and differences in absolute structure refinement
- PMID: 23719469
- PMCID: PMC3661305
- DOI: 10.1107/S2052519213010014
Use of intensity quotients and differences in absolute structure refinement
Abstract
Several methods for absolute structure refinement were tested using single-crystal X-ray diffraction data collected using Cu Kα radiation for 23 crystals with no element heavier than oxygen: conventional refinement using an inversion twin model, estimation using intensity quotients in SHELXL2012, estimation using Bayesian methods in PLATON, estimation using restraints consisting of numerical intensity differences in CRYSTALS and estimation using differences and quotients in TOPAS-Academic where both quantities were coded in terms of other structural parameters and implemented as restraints. The conventional refinement approach yielded accurate values of the Flack parameter, but with standard uncertainties ranging from 0.15 to 0.77. The other methods also yielded accurate values of the Flack parameter, but with much higher precision. Absolute structure was established in all cases, even for a hydrocarbon. The procedures in which restraints are coded explicitly in terms of other structural parameters enable the Flack parameter to correlate with these other parameters, so that it is determined along with those parameters during refinement.
Keywords: absolute structure refinement; intensity quotients.
Figures
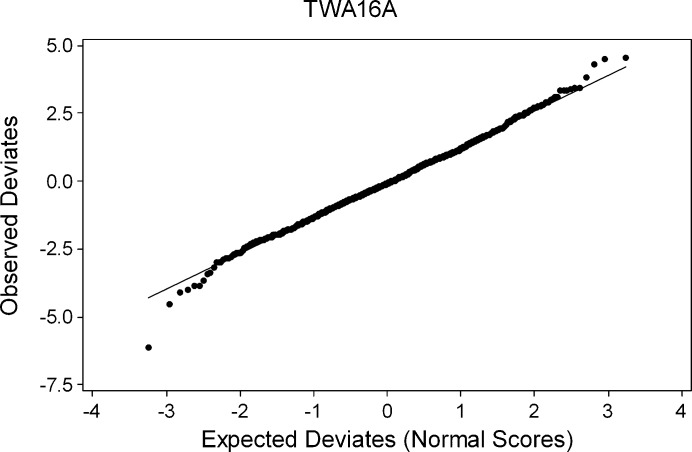
 for TWA16a. The extreme point at the bottom left was omitted as an outlier. This plot was calculated prior to rescaling of weights.
References
-
- Abrahams, S. C. & Keve, E. T. (1971). Acta Cryst. A27, 157–165.
-
- Bernardinelli, G. & Flack, H. D. (1985). Acta Cryst. A41, 500–511.
-
- Betteridge, P. W., Carruthers, J. R., Cooper, R. I., Prout, K. & Watkin, D. J. (2003). J. Appl. Cryst. 36, 1487.
-
- Beurskens, P. T., Beurskens, G., Bosman, W. P., de Gelder, R., Garcia-Granda, S., Gould, R. O., Israel, R. & Smits, J. M. M. (1996). DIRDIF96. University of Nijmegen, The Netherlands.
-
- Blessing, R. H. (1995). Acta Cryst. A51, 33–38. - PubMed
MeSH terms
Substances
LinkOut - more resources
Full Text Sources
Other Literature Sources