. 2013 May 29;33(22):9235-45.
doi: 10.1523/JNEUROSCI.4143-12.2013.

Distinct inspiratory rhythm and pattern generating mechanisms in the preBötzinger complex

Affiliations

Distinct inspiratory rhythm and pattern generating mechanisms in the preBötzinger complex

Kaiwen Kam et al. J Neurosci. .

Abstract

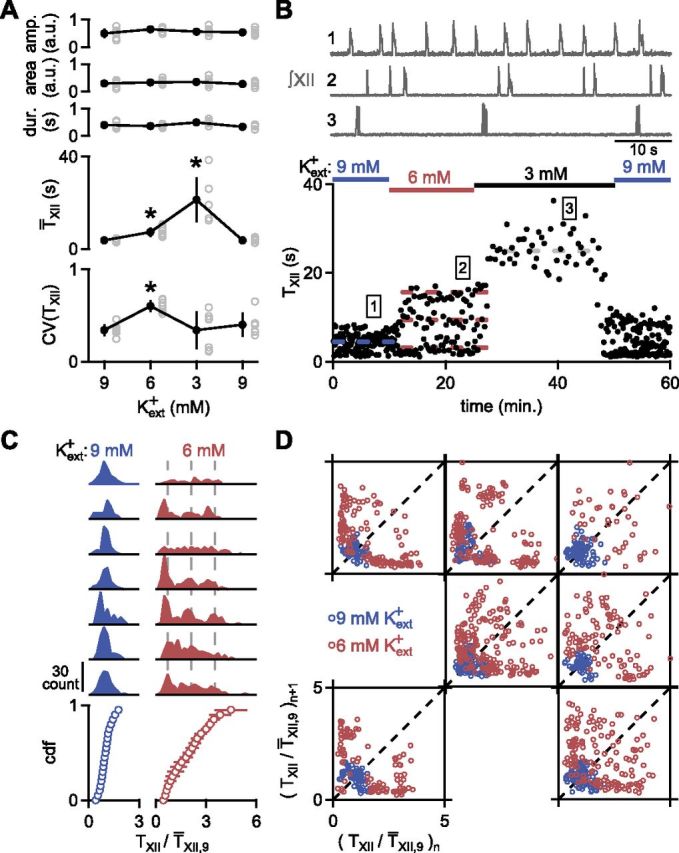
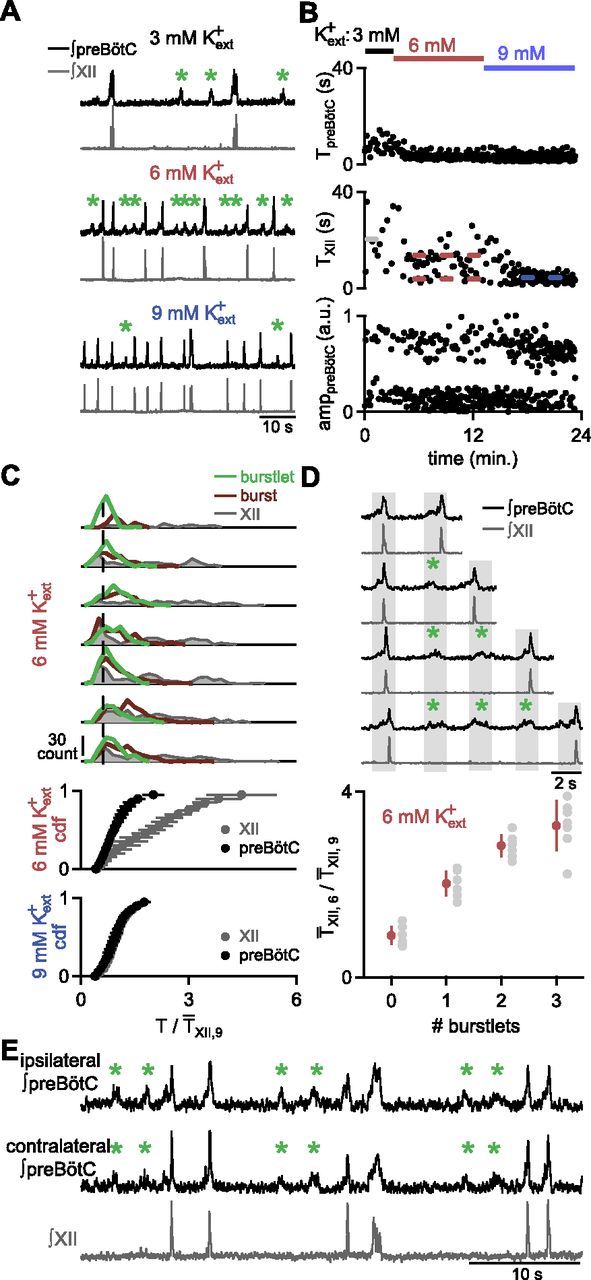
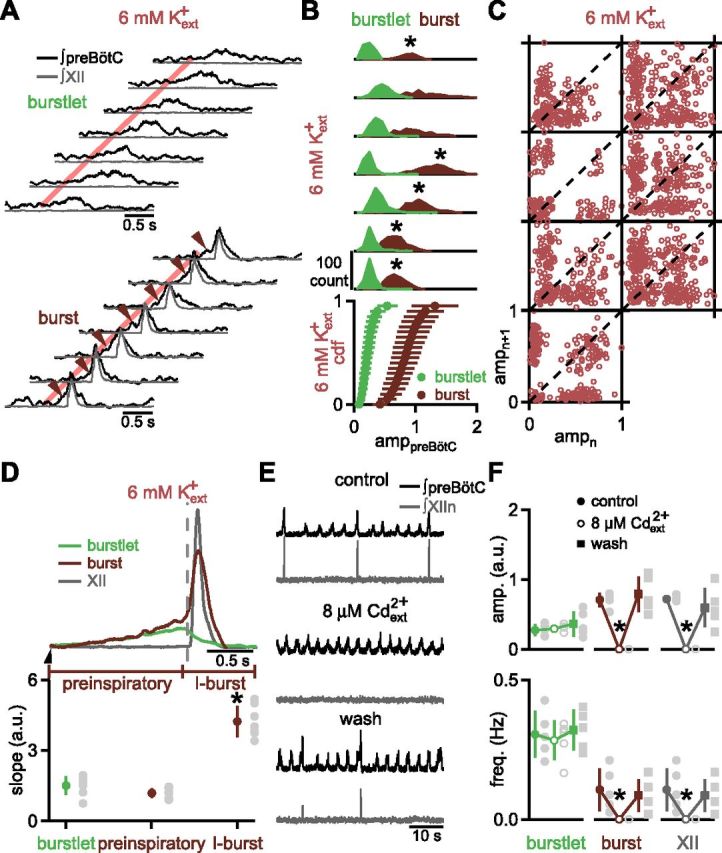
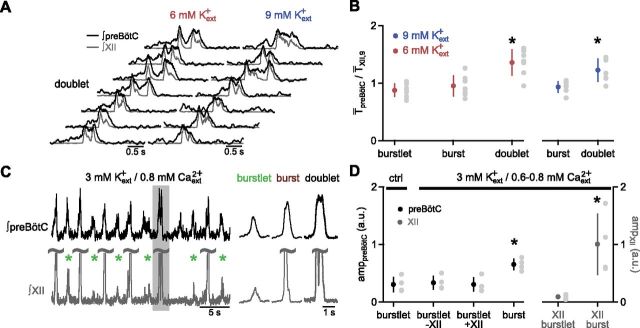
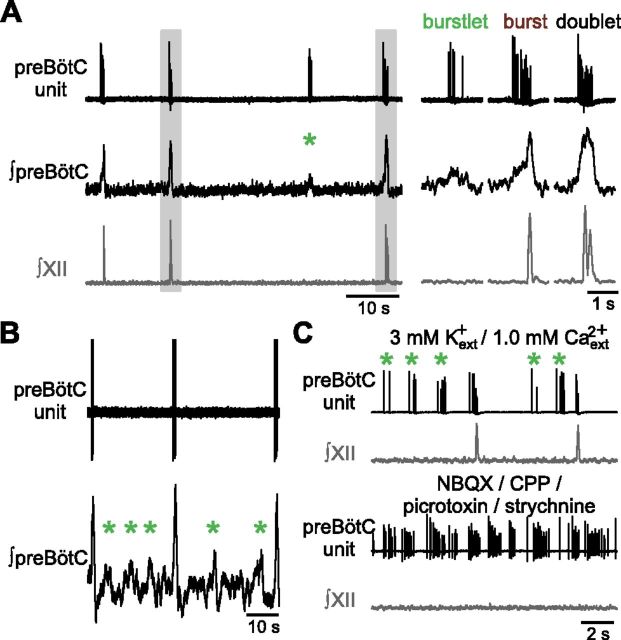
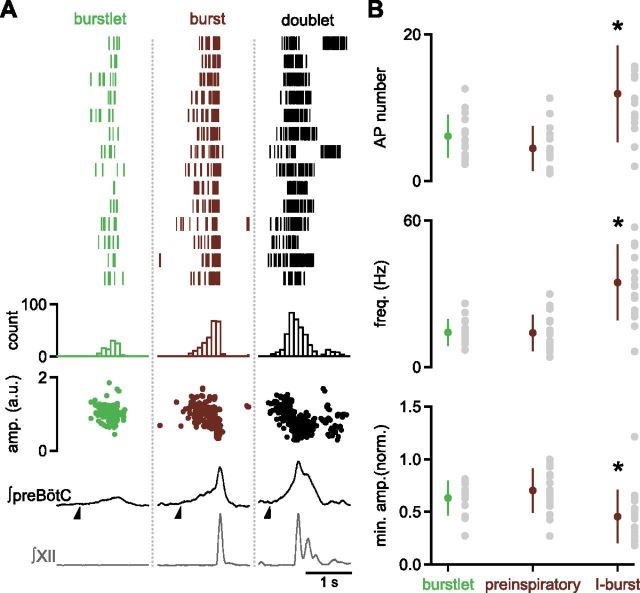
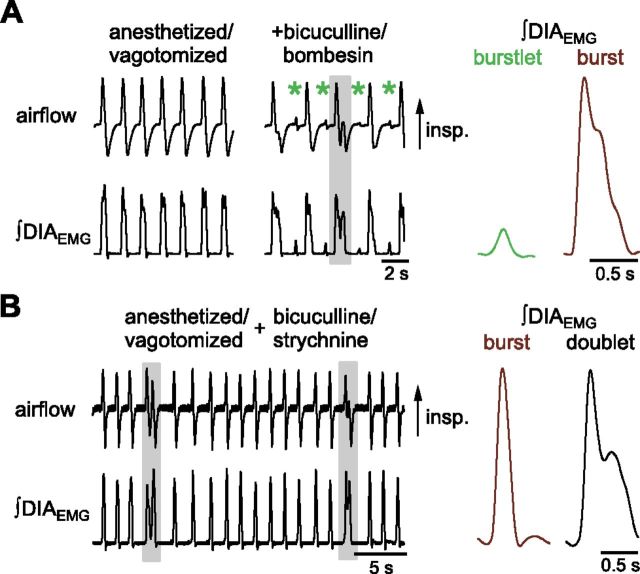
In the mammalian respiratory central pattern generator, the preBötzinger complex (preBötC) produces rhythmic bursts that drive inspiratory motor output. Cellular mechanisms initiated by each burst are hypothesized to be necessary to determine the timing of the subsequent burst, playing a critical role in rhythmogenesis. To explore mechanisms relating inspiratory burst generation to rhythmogenesis, we compared preBötC and hypoglossal (XII) nerve motor activity in medullary slices from neonatal mice in conditions where periods between successive inspiratory XII bursts were highly variable and distributed multimodally. This pattern resulted from rhythmic preBötC neural population activity that consisted of bursts, concurrent with XII bursts, intermingled with significantly smaller "burstlets". Burstlets occurred at regular intervals during significantly longer XII interburst intervals, at times when a XII burst was expected. When a preBötC burst occurred, its high amplitude inspiratory component (I-burst) was preceded by a preinspiratory component that closely resembled the rising phase of burstlets. Cadmium (8 μM) eliminated preBötC and XII bursts, but rhythmic preBötC burstlets persisted. Burstlets and preinspiratory activity were observed in ~90% of preBötC neurons that were active during I-bursts. When preBötC excitability was raised significantly, burstlets could leak through to motor output in medullary slices and in vivo in adult anesthetized rats. Thus, rhythmic bursting, a fundamental mode of nervous system activity and an essential element of breathing, can be deconstructed into a rhythmogenic process producing low amplitude burstlets and preinspiratory activity that determine timing, and a pattern-generating process producing suprathreshold I-bursts essential for motor output.


Figures

Figure 1.
Figure 1.
Increase in rhythmic variability arises from a multimodal distribution of periods. A, Normalized integrated XII burst amplitude (amp.), area, and duration (dur.) did not change significantly as Kext+ was decreased from 9 to 6 mm to 3 mm, then back to 9 mm. T̄XII increased monotonically as Kext+ was decreased. CV(TXII) was maximal at 6 mm Kext+. Amplitude and area are measured in a.u. Data are mean ±SD (*p < 0.05; n = 7) with means for each slice depicted as gray circles. B, Time course of TXII in one experiment after changing from 9 to 6 mm to 3 mm Kext+ (bottom) reveals multiple discrete values of TXII in 6 mm Kext+. Representative traces in 3, 6, and 9 mm Kext+ of XII output (top) are taken at time points indicated at bottom. Doublets, e.g., seventh burst in 9 mm Kext+ and third and ninth burst in 6 mm Kext+, were also observed. Horizontal dashed lines represent means of Gaussians fitted to data in each condition. In 6 mm Kext+ intervals are present at 9 and 15 s, approximately three and five times the lowest TXII of 3 s. C, Increase in CV(TXII) in 6 mm Kext+ arose from a multimodal distribution of TXII. (Top) Distributions of TXII normalized to T̄XII,9 for seven slices in 9 mm (left, blue) and 6 mm (right, red) Kext+. Vertical dashed lines represent integer multiples of average value of shortest peak. (Bottom) Averaged cdfs. Data are mean ± SD (note, SDs are too small to see in most cases). D, Multimodal distribution did not result from non-stationarity (n = 7 slices). Poincaré plots of TXII/ T̄XII,9 show single clusters near the unity line (dashed line) in 9 mm Kext+ (blue), indicating regularity in the rhythm throughout each experiment. In 6 mm Kext+ (red), a quasiperiodic distribution is evident with clusters located away from unity line. Clusters near axes indicate alternating short and long TXII.
Figure 2.
Figure 2.
Higher frequency burstlets in preBötC underlie the multimodal distribution of TXII. A, Representative traces of simultaneous XII output (gray) and preBötC (black) recordings in 9, 6, and 3 mm Kext+ show bursts (large amplitude preBötC events that generate XII output) and burstlets (smaller amplitude preBötC events that do not result in XII activity; indicated with green asterisk). XII and preBötC doublets, e.g., fifth burst in 6 mm Kext+ and eighth burst in 9 mm Kext+, were also observed. B, Representative time course of XII output and preBötC population recording in 9, 6, and 3 mm Kext+ showing TpreBötC (top), TXII (middle), and amplitudes of preBötC events, i.e., burstlets and bursts (amppreBötC; bottom) in a.u. TpreBötC shows lower variability compared with TXII. AmppreBötC is bimodal. C, Top, Distributions of burstlet→next event (burstlet, burst, or doublet; green) and burst→next event (maroon) TpreBötC,6, and TXII,6 (gray), all normalized to T̄XII,9 for individual slices. Dotted line represents average value of shortest peak in TXII distribution. C, Bottom, Cdfs of TXII (gray) and TpreBötC (black) in 9 and 6 mm Kext+ show significant overlap in 9 mm Kext+, whereas the distribution of TpreBötC is significantly different from that of TXII in 6 mm Kext+. Data are mean ±SD (n = 7). D, Top, Representative traces of preBötC (black) and XII (gray) recordings with different numbers of burstlets during the IBI show that TXII increased monotonically with the number of burstlets. Gray bars indicate when the next burstlet was expected (green asterisk indicate burstlets). D, Bottom, T̄XII,6/ T̄XII,9 as a function of the number of burstlets in the IBI demonstrate that T̄XII,6 increases monotonically with the number of burstlets (n = 7; bottom). Means for each slice are depicted as gray circles. E, Simultaneous recording of XII (gray) and ipsi- and contralateral preBötC (black) population activity show that burstlets (green asterisk) are bilaterally synchronous. Doublets, e.g., fourth burst, were also observed bilaterally in preBötC.
Figure 3.
Figure 3.
Mechanisms underlying preBötC burst and burstlet generation are distinct and separable. A, Representative traces of preBötC (black) and XII (gray) recordings during burstlets (top) or bursts (bottom) in 6 mm Kext+ highlight preinspiratory activity (arrows) preceding the preBötC I-burst. Red line indicates onset of preBötC burstlet and burst. B, In 6 mm Kext+, burstlet amplitude is significantly smaller than burst amplitude (n = 7). B, Top, Distributions of preBötC burstlet (green) and burst (maroon) amplitudes show a clear bimodal distribution that justifies this categorization. Asterisk indicates distribution is significantly bimodal, p < 0.05. B, Bottom, Cdfs of amplitude of preBötC events (amppreBötC) show significantly different burstlet and burst amppreBötC. Data are mean ±SD. C, Representative Poincaré plots of amppreBötC in 6 mm Kext+. Small and large amplitude preBötC events, likely representing burstlets and bursts, respectively, are temporally intermingled, and amplitudes are not continuously distributed. D, Top, Superimposed average waveforms of XII bursts (gray) and preBötC burstlets and bursts indicate significant overlap in burstlets (green) and preinspiratory rise (maroon) of bursts. Vertical dotted line indicates start of XII inspiratory burst and line below traces indicates division of preBötC bursts into preinspiratory and I-burst components. Half-arrow indicates onset of preBötC burstlet and burst. D, Bottom, Average slopes for rising phase of burstlets and preinspiratory and I-burst components of preBötC bursts in a.u. Preinspiratory rate of rise does not differ significantly from that of burstlets, but is significantly less than I-burst rate of rise. Data are mean ±SD (*p < 0.05; n = 7) with means for each slice as gray circles. E, Cadmium (Cdext2+) abolishes preBötC bursts and all XII output while burstlets continue. Representative traces showing effects of 8 μm Cdext2+ on preBötC (black) and XII (gray) recording. F, Average data show amplitude and frequency of preBötC burstlets (green) and preBötC (maroon) and XII (gray) bursts in control, 8 μm Cdext2+, and wash out. Data are mean ±SD (*p < 0.05; n = 5) with means for each slice as gray symbols.
Figure 4.
Figure 4.
Patterning of XII output is not restricted to preBötC burst generation. A, Representative traces of simultaneous recordings of preBötC (black) and XII (gray) activity during doublets in 9 and 6 mm Kext+ demonstrating that preBötC activity during doublets does not drop to baseline during the pause between peaks in XII output. B, Burstlet→next event, burst→next event, and doublet→next event T̄preBötC, normalized to T̄XII,9. In 6 and 9 mm Kext+, doublet→next event T̄preBötC is longer than both burstlet→next event and burst→next event T̄preBötC, whereas burstlet→next event and burst→next event T̄preBötC do not differ. Data are mean ±SD (*p < 0.05; n = 7) with means for each slice as gray circles. C, Left, Respiratory-related rhythm in 3 mm Kext+ and 0.8 mm Caext2+ had burstlets (indicated by green asterisk) and doublets (indicated by gray box), in both preBötC (black) and XII output (gray). C, Right, Average XII (gray) and preBötC (black) traces during burstlets, bursts, and doublets show the differences in amplitude. XII bursts and doublets are trimmed (represented by ∼), in both left and right, to show XII burstlets. D, Amplitudes of preBötC (amppreBötC) and XII (ampXII) burstlets and bursts in control (ctrl) and 3 mm Kext+ and 0.6–0.8 mm Caext2+ in a.u. Burst amplitudes are significantly larger than burstlets in both preBötC and XII, whereas amplitudes of preBötC burstlets associated with XII burstlets (burstlet+XII) do not differ significantly from control preBötC burstlet amplitude or amplitudes of burstlets not associated with XII burstlets (burstlet-XII) in 3 mm Kext+ and 0.6–0.8 mm Caext2+. Data are mean ±SD (*p < 0.05; n = 4) with means for each slice as gray circles.
Figure 5.
Figure 5.
Single unit recordings show individual preBötC neurons fire during burstlets and bursts. A, Left, Representative traces of XII (gray), preBötC population activity (black) and a preBötC neuron (black) in 3 mm Kext+/1 mm Caext2+, indicating spiking during both burstlets (green asterisk), bursts, and doublets (gray box). A, Right, Expanded time scales for recordings during a burstlet, burst, and doublet for the experiment shown demonstrate changes in duration, AP number, frequency, and amplitude between preBötC event categories. B, Representative traces of preBötC neuron and contralateral preBötC population activity showing a burst only neuron (green asterisk indicate burstlets). C, Neuron showing burstlet (indicated by green asterisk) and burst activity that also displayed pacemaker properties when glutamatergic, GABAergic, and glycinergic synaptic transmission were blocked with NBQX (10 μm), CPP (10 μm), picrotoxin (100 μm), and strychnine (1 μm).
Figure 6.
Figure 6.
Characteristics of preBötC neuron firing patterns during burstlets and bursts. A, Top, APs during burstlets (left, green), bursts (middle, maroon), or doublets (right, black) of one preBötC inspiratory-modulated neuron. Each line of each column of the raster plot represents APs of recorded neuron during a single burstlet, burst, or doublet. A, Middle, Histograms of raster plots show the average AP frequency during burstlets, bursts, and doublets. A, Bottom, Amplitudes of APs over time during burstlets, bursts, and doublets are shown below the histograms. Time course of amplitude shows that AP waveform does not change significantly during burstlets, but decreases during bursts and doublets. After a pause in firing during some doublets, more APs are seen, corresponding to a second peak in the doublet. Raster plots, histograms, and amplitudes in a.u. are aligned to the average burstlet or XII burst/doublet waveform. Half-arrow indicates onset of preBötC burstlet, burst, and doublet. B, Comparison of firing pattern properties including AP number, frequency, and minimum amplitude normalized to the first AP in the event during burstlets (green), and the preinspiratory and I-burst components (maroon) of bursts in inspiratory-modulated neurons. Data are mean ±SD (*p < 0.05; n = 16) with means for each slice as gray circles.
Figure 7.
Figure 7.
Burstlet/burst/doublet rhythms elicited in vivo. A, Respiratory pattern is shown in anesthetized and vagotomized adult rat before and after bicuculline injection into preBötC and BötC and bombesin injection into preBötC only. A, Left, Airflow and integrated DIAEMG activity. After local injection of bicuculline and bombesin, small bursts (indicated by green asterisk) appeared between inspiratory bursts that resemble leak through of burstlets seen in vitro (Fig. 4B). Doublets, e.g., gray box, were also observed. A, Right, Average integrated DIAEMG during burstlets (green) and bursts (maroon). B, Left, After vagotomy and injection of bicuculline and strychnine into preBötC, doublet bursts appeared. Gray boxes indicate doublets. B, Right, Average integrated waveforms of DIAEMG from 20 bursts (maroon) and doublets (black) after vagotomy and injection of inhibitory antagonists. While doublet peaks were not significantly different, the second peak in the average doublet waveform appears smaller due to alignment of doublets by their onset and differences in the doublet intrapeak interval.

Similar articles

Cited by

References

    1. Butera RJ, Jr, Rinzel J, Smith JC. Models of respiratory rhythm generation in the pre-Bötzinger complex: I. Bursting pacemaker neurons. J Neurophysiol. 1999a;82:382–397. - PubMed
    1. Butera RJ, Jr, Rinzel J, Smith JC. Models of respiratory rhythm generation in the pre-Bötzinger complex: II. Populations of coupled pacemaker neurons. J Neurophysiol. 1999b;82:398–415. - PubMed
    1. Chamberlin NL, Eikermann M, Fassbender P, White DP, Malhotra A. Genioglossus premotoneurons and the negative pressure reflex in rats. J Physiol. 2007;579:515–526. doi: 10.1113/jphysiol.2006.121889. - DOI - PMC - PubMed
    1. Cherniack NS, von Euler C, Glogowska M, Homma I. Characteristics and rate of occurrence of spontaneous and provoked augmented breaths. Acta Physiol Scand. 1981;111:349–360. doi: 10.1111/j.1748-1716.1981.tb06747.x. - DOI - PubMed
    1. Del Negro CA, Johnson SM, Butera RJ, Smith JC. Models of respiratory rhythm generation in the pre-Bötzinger complex: III. Experimental tests of model predictions. J Neurophysiol. 2001;86:59–74. - PubMed

Publication types