. 2013 May 29;33(22):9246-58.
doi: 10.1523/JNEUROSCI.0946-13.2013.

Conflicts between local and global spatial frameworks dissociate neural representations of the lateral and medial entorhinal cortex

Affiliations

Conflicts between local and global spatial frameworks dissociate neural representations of the lateral and medial entorhinal cortex

Joshua P Neunuebel et al. J Neurosci. .

Erratum in

  • J Neurosci. 2013 Aug 7;33(32):13249

Abstract

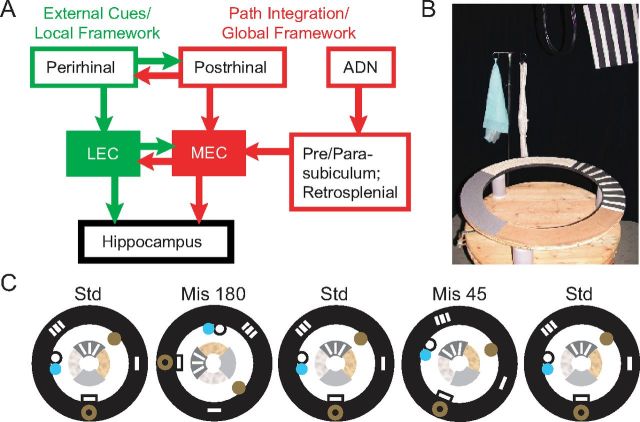
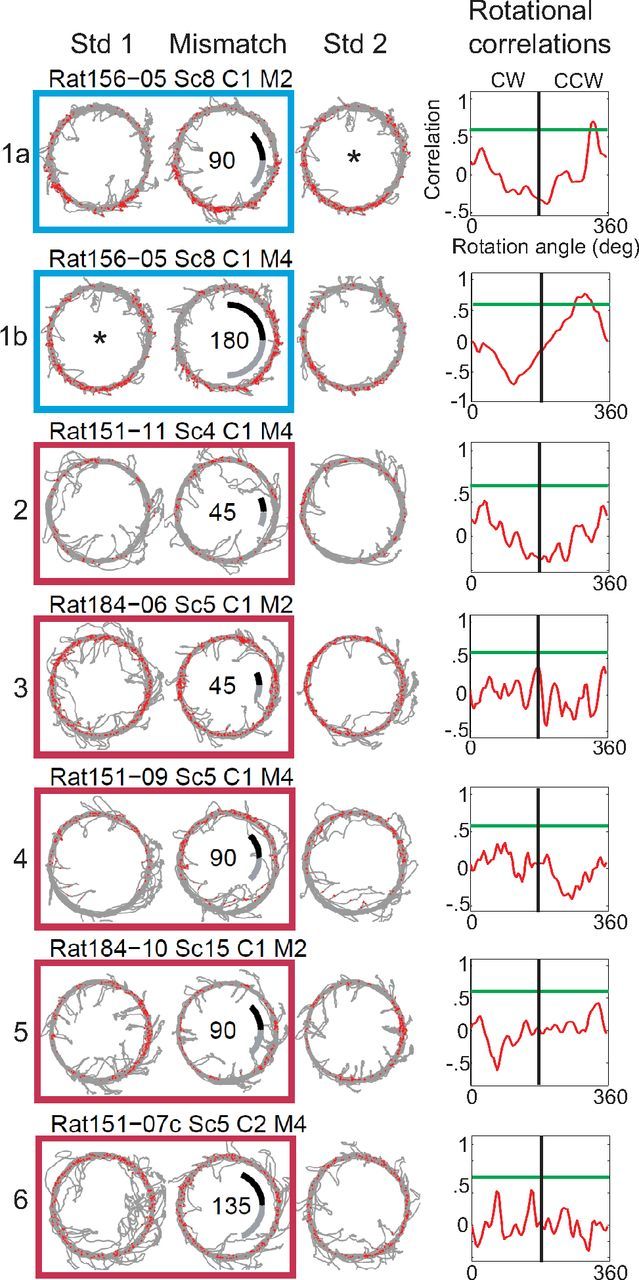
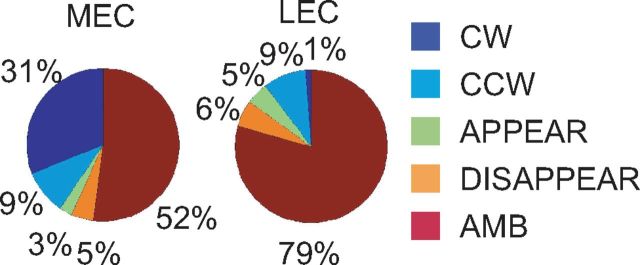
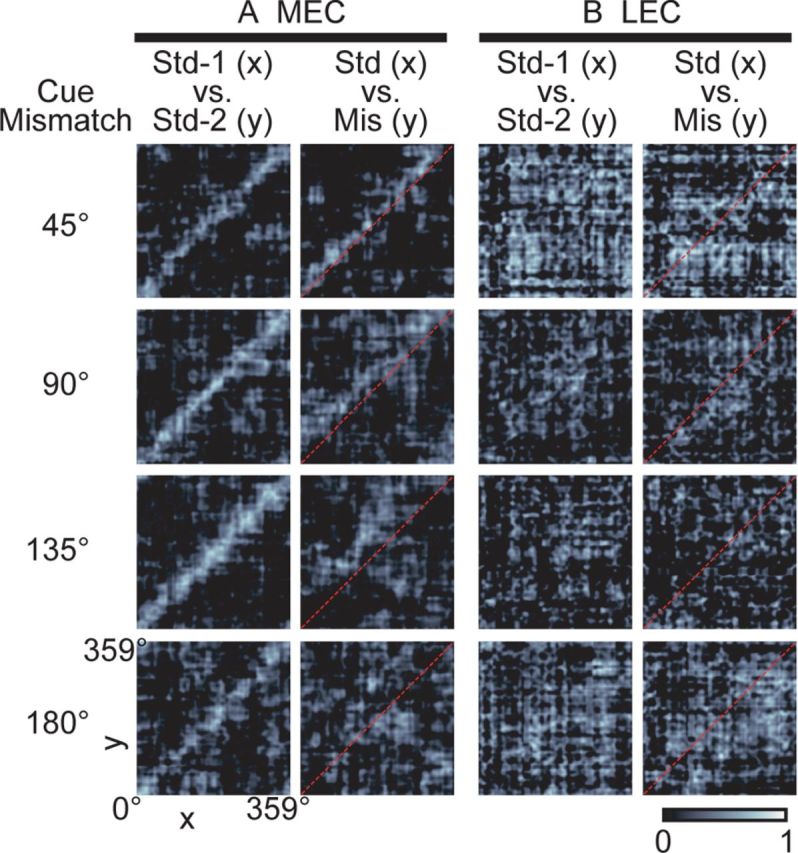
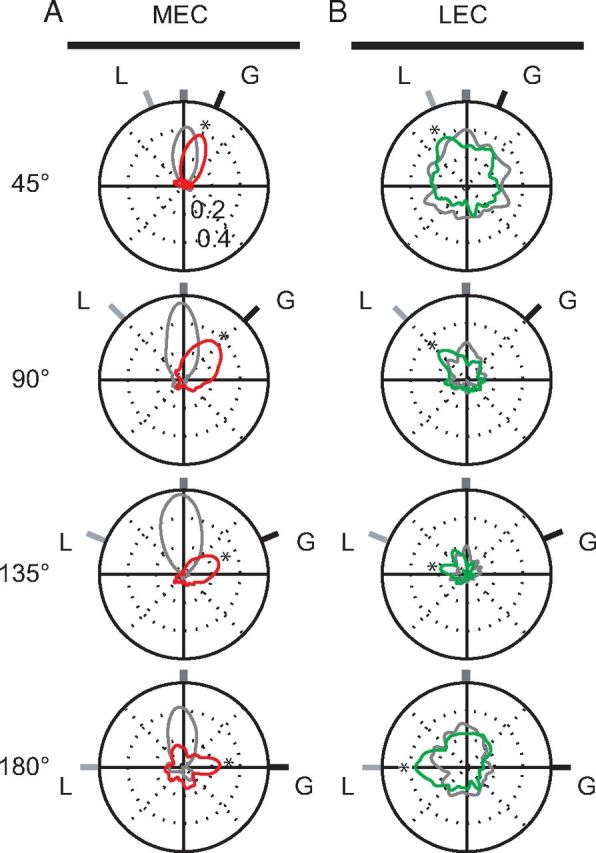
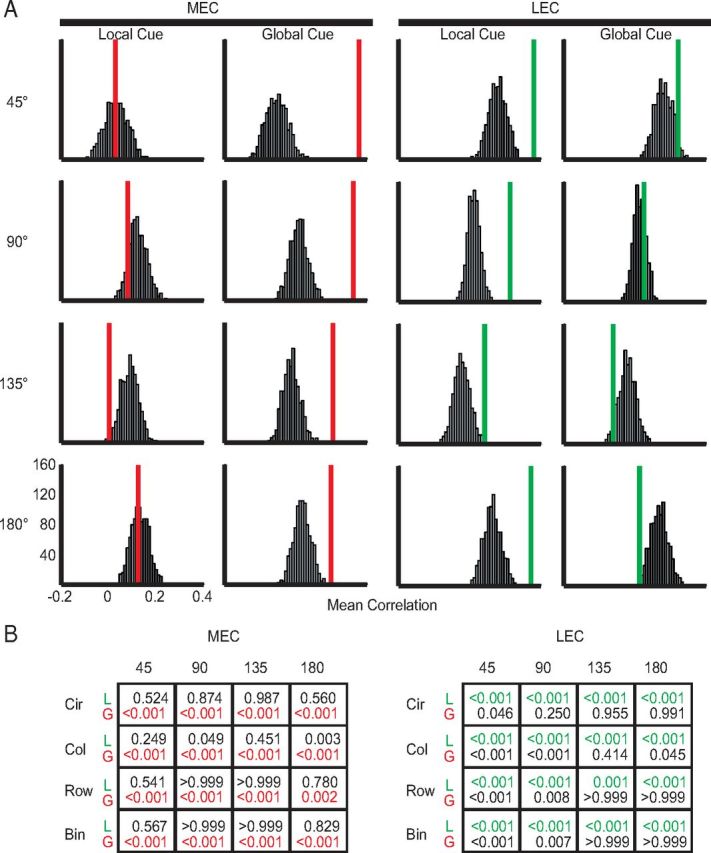
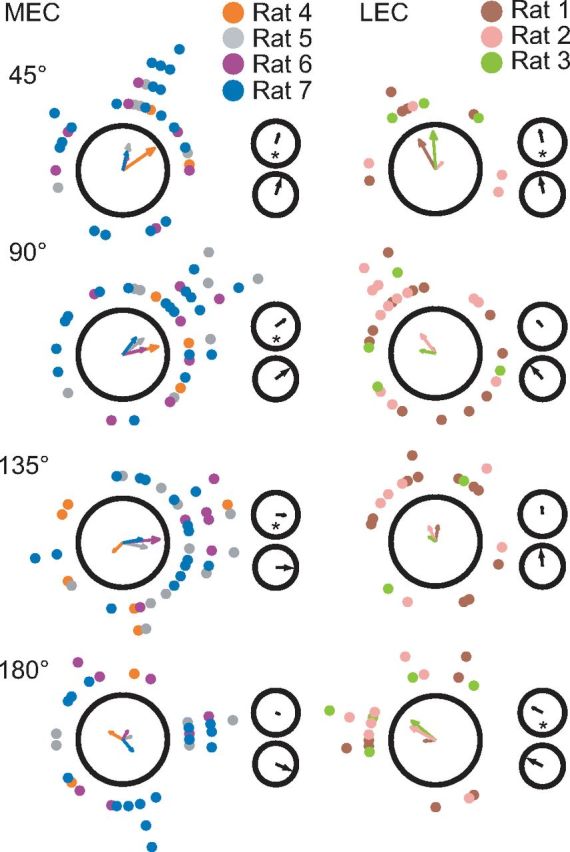
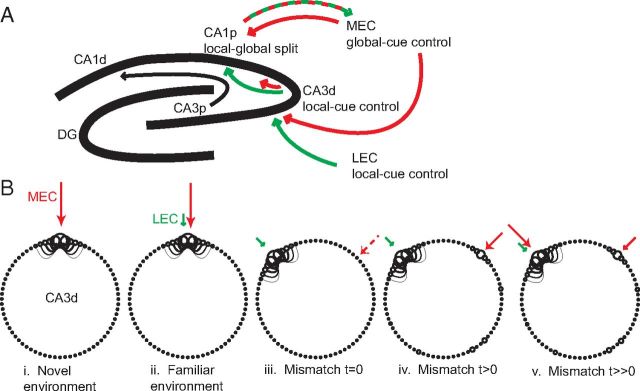
Manipulation of spatial reference frames is a common experimental tool to investigate the nature of hippocampal information coding and to investigate high-order processes, such as cognitive coordination. However, it is unknown how the hippocampus afferents represent the local and global reference frames of an environment. To address these issues, single units were recorded in freely moving rats with multi-tetrode arrays targeting the superficial layers of the lateral entorhinal cortex (LEC) and medial entorhinal cortex (MEC), the two primary cortical inputs to the hippocampus. Rats ran clockwise laps around a circular track partitioned into quadrants covered by different textures (the local reference frame). The track was centered in a circular environment with distinct landmarks on the walls (the global reference frame). Here we demonstrate a novel dissociation between MEC and LEC in that the global frame controlled the MEC representation and the local frame controlled the LEC representation when the reference frames were rotated in equal, but opposite, directions. Consideration of the functional anatomy of the hippocampal circuit and popular models of attractor dynamics in CA3 suggests a mechanistic explanation of previous data showing a dissociation between the CA3 and CA1 regions in their responses to this local-global conflict. Furthermore, these results are consistent with a model of the LEC providing the hippocampus with the external sensory content of an experience and the MEC providing the spatial context, which combine to form conjunctive codes in the hippocampus that form the basis of episodic memory.


Figures

Figure 1.
Figure 1.
Experimental design. A, Simplified schematic illustrating the information flow through the hippocampal formation. The MEC, in conjunction with postrhinal cortex, retrosplenial cortex, anterior dorsal nucleus of the thalamus (ADN), and the presubiculum and parasubiculum, may carry a path integration signal to the hippocampus, oriented by the global cues in the environment. The LEC, in conjunction with the perirhinal cortex, may convey local, external sensory input to the hippocampus. B, Recording environment. C, One day of the experimental protocol consisted of three standard sessions interleaved with two cue-mismatch sessions. The mismatch angles depicted are 180° and 45°.
Figure 2.
Figure 2.
Data shuffling and reduction procedures for statistical analysis of correlation matrices. A, Illustration showing population correlation analysis for standard versus mismatch sessions. B–E, To determine whether the peak magnitudes of the correlation matrices were greater than expected by chance, four different shuffling procedures were used on the mismatch data to create null correlation matrices (Louie and Wilson, 2001). Shuffling the rows (B) kept each population vector intact but randomly redistributed the vectors to different locations on the track. Shuffling the columns (C) kept the firing profile of each cell intact but randomly reassigned cell identifications. Randomly rearranging each bin in the mismatch data (D) completely randomized the dataset. Circularly shifting the firing rate map of each cell (E) kept the firing profile and identification of each cell intact but shifted the rate map along the track by a random amount, thus creating new activity vectors at each bin. F, Illustration showing regions of the population correlation matrices used to calculate the mean correlations for the 360 diagonals. Blue, green, red, and violet lines show regions of the matrix used to determine mean correlations for diagonals 0°, 90°, 180°, and 270°, respectively. The shaded gray areas in the correlation matrix (diagonals 1°–179°) represent a local cue response (L) (CCW rotation), whereas the black areas (diagonals 181°–359°) indicate a global cue response (G) (CW rotation). Averaging the correlation values of the 2D matrix along the diagonals creates the 1D correlation curve in the middle. The curve presented here illustrates an idealized example (for a region with strong spatial firing) of a correlation curve between two standard sessions, in which the highest correlation is along the 0° diagonal (demonstrating spatial stability between sessions) and the correlations decrease gracefully along adjacent diagonals. In STD–MIS comparisons, peaks occurring along the gray portion of the curve would indicate local cue control of the representation, whereas peaks occurring along the black portion of the curve would indicate global cue control. Transforming the Cartesian coordinates of the 1D correlation curve to a polar coordinate system created the polar plot shown at the right.
Figure 3.
Figure 3.
Characterization of entorhinal cell types. A, B, Histology examples show the locations of tetrodes targeting MEC (A) and LEC (B). Scale bars, 500 μm. Arrows indicate tips of tetrode tracks. Recordings from MEC and LEC were located in regions that project to both septal and temporal levels of the hippocampus. C, D, For all well-isolated MEC (C) and LEC (D) cells recorded in the first standard session of the day, the mean firing rates (hertz; abscissa) and spike widths (milliseconds; ordinate) were plotted to classify different cell types. Two distinct groups of cells were observed in the MEC (putative principal cells with wider spikes and a mean firing rate <10 Hz and putative interneurons with narrower spikes and a mean firing rate ≥10 Hz), whereas only one group of cells was recorded in the LEC (firing rate <5 Hz). E, F, Histograms show the spatial information scores based on 2D rate maps for the first daily standard sessions of MEC (E) and LEC (F) cells. These data are nearly identical to those in the study by Yoganarasimha et al. (2011), with slight changes in the cell count attributable to differences in analysis inclusion criteria between the two studies.
Figure 4.
Figure 4.
Examples of MEC cellular responses. Example spike (red points) and trajectory (gray line) plots of representative cells showing three consecutive sessions (standard, mismatch, and standard). Numbers in the center of all mismatch sessions indicate the total mismatch angle. The gray and black arcs show the amount of the local and global cue rotations, respectively. The colored boxes indicate the classification of the cell for the STD 1–MIS comparison: navy blue, CW rotation; cyan, CCW rotation; maroon, ambiguous response; and green, appearance of place field. To the right of each set of place fields is a graph of the rotation correlation analysis between the STD 1 and MIS sessions. Correlations above 0.6 (green line) were considered strong enough to indicate an unambiguous response to the mismatch. Peaks above 0.6 to the left or right of 180° (black vertical line) indicated that the fields rotated CW or CCW, respectively, in the mismatch session. For a description of individual cells, see Results.
Figure 5.
Figure 5.
Examples of LEC cellular responses. The layout of the figure is identical to Figure 4. For descriptions of individual cells, see Results.
Figure 6.
Figure 6.
Proportion of cellular responses. Percentage of cells categorized as CW (navy blue), CCW (cyan), appear (green), disappear (orange), or ambiguous (AMB; maroon) for each region. The numbers of cells in each category are as follows: LEC: total (87), CW (1), CCW (8), appear (4), disappear (5), ambiguous (69); MEC: total (148), CW (46), CCW (14), appear(4), disappear (7), ambiguous (77). The cellular responses were significantly different between regions (χ2 = 31.8; p < 0.001).
Figure 7.
Figure 7.
Population responses to cue–mismatch manipulations. Spatial correlation matrices were produced by correlating the normalized firing rate vectors for a standard session with those of the following mismatch or standard session. A, MEC representations maintained coherence in all standard–standard and standard–mismatch sessions, indicated by the bands of high correlation (white), which shifted above the main diagonal (dashed red line) in the mismatch session. The correlation degraded with the increasing magnitude of the local–global cue mismatch. B, In contrast to the MEC, the LEC representations showed less obvious structure in either the standard–standard or standard–mismatch comparisons.
Figure 8.
Figure 8.
Polar plots demonstrate global cue control over MEC firing and local cue control over LEC firing. The polar plots were created from the LEC and MEC spatial correlation matrices to represent the population activity between STD 1 versus STD 2 (gray) and standard versus mismatch (color) sessions. The peaks (marked by asterisks) in the MEC plots (red) follow the global (G) cues (A), whereas the peaks in the LEC plots (green) follow the local (L) cues (B).
Figure 9.
Figure 9.
Data shuffling analyses. A, To determine whether the global and local cue control over MEC and LEC representations was greater than expected by chance, the mean correlations obtained from the shuffle analyses were compared with the actual data. The distributions (gray) show the results from the circle shift and the actual data (red lines, MEC; green lines, LEC) for all mismatch angles. Inspection of all local cue distributions for the LEC and global cue distributions for the MEC reveals that these correlations were all well above chance level (p < 0.001). In contrast, the correlations for the nonpreferred cue set were not significant (p > 0.01). B, Chart shows the probabilities that correlations produced by the four types of shuffling procedures at locations predicted by local and global cue sets were greater than the real data. If the peak correlation for the real data corresponded to the local cues (L), the probability is displayed in green; if the peak correlation of the real data corresponded to the global cues (G), the probability is displayed in red. For some of the smaller rotations, the nonpreferred cue set also had significant correlations, but the magnitude of the correlations was smaller than the preferred cue set.
Figure 10.
Figure 10.
Individual cell responses and comparisons across subjects. Each dot indicates the amount that the spatial firing of a cell rotated between the standard and mismatch sessions, color coded to identify each rat (n = 7). Colored arrows represent the mean vectors for each rat. The distributions of rotation angles for LEC and MEC were similar for individual rats (Table 1). The small circles to the right of the main plots indicate the mean vector of the entire sample of cells collapsed across subjects (top) and the mean unit vector (bottom), added here to emphasize the orientation of the vector. The mean vector length for MEC cells was significant (*) for all mismatch angles except for the 180° mismatch, whereas the mean vector length for LEC was variable (Rayleigh's test; LEC, 45° and 180°, p < 0.03; MEC, 45°, 90°, and 135°, p < 0.002).
Figure 11.
Figure 11.
Functional anatomy of local–global cue influences on the CA1 and CA3 networks. A, Previous studies have shown that the proximal CA1 region (CA1p, the region of CA1 closer to CA3) shows a split representation in the double rotation experiment, whereas the distal CA3 region (CA3d, the region of CA3 closer to CA1 and which projects to CA1p) shows a more coherent representation than CA1p; the CA3d representation is controlled by the local cues. CA1p also receives direct input from MEC. Thus, the split representation of CA1p may be the result of conflicting inputs it receives from CA3d and MEC. This split representation is returned to MEC by a feedback pathway to the deep layers of MEC. The joint local–global control in the CA1 output under the extreme cue conflicts of the present experiment may be an aberrant reflection of the normal processing of CA1 because it compares the incoming input from MEC about the current state of the animal's experience with the stored memories in CA3 of the animal's previous experience. B, Conceptual model of how putative attractor dynamics of CA3 might cause the local-cue dominance over CA3 place fields. For simplicity, CA3 is represented as a ring attractor to illustrate the firing of the cells on the circular track rather than its standard conception as a 2D sheet or point attractor. Each circle represents a CA3 cell that fires when the rat is on the corresponding location on the track; the diameter of the circle indicates the current firing rate. Excitatory connections between cells with nearby place fields are shown, with the strength of connection decreasing with place field distance. With appropriate weights and global inhibition (data not shown), an attractor forms. The location of the “bump” of activity can be set even by a weak external input (Zhang, 1996). Active external inputs from MEC and LEC are shown as colored lines. The length of the line corresponds to the relative strength of the input. i, In a novel environment, it is assumed that the spatial firing of the network is driven primarily by MEC inputs. ii, After the environment is familiar, it is assumed that local cue information from LEC has acquired, through a Hebbian association, a degree of control over the CA3 activity. The arrow is small, indicating that the spatial signal of LEC is weak. iii, In the first moments after the rat is placed on the track in the mismatch session (here depicted as a 90° mismatch), we hypothesize that MEC inputs are compromised as a result of potential attentional mechanisms in which the rat first attends to the local cues as it is placed on the track. Thus, the bump of activity is initially controlled by the weak, local-cue-dominated signals demonstrated by LEC. iv, When the rat switches attention to the global landmarks, the MEC grid is aligned and excites the CA3 network at the location predicted by global cues. However, if the attractor dynamics are strong, the bump of activity already present at the local-cue-predicted location might hinder the ability of this external drive to control the bump. Nonetheless, the external drive could still excite these cells to some degree, causing perturbations in the network that allow cells at other location to become active (partial remapping). v, After a few laps, we predict that CA3 and MEC cells learn a new mapping, such that MEC can take over its normal role as a primary drive on the spatial firing of the CA3 cells. Perhaps the secondary bump would disappear over time if the mismatch environment remains stable, as that bump loses the competition with the stronger bump that is consistent with inputs from CA3, LEC, and MEC.

Comment in

Similar articles

Cited by

References

    1. Alonso A, García-Austt E. Neuronal sources of theta rhythm in the entorhinal cortex of the rat. I. Laminar distribution of theta field potentials. Exp Brain Res. 1987a;67:493–501. doi: 10.1007/BF00247282. - DOI - PubMed
    1. Alonso A, García-Austt E. Neuronal sources of theta rhythm in the entorhinal cortex of the rat. II. Phase relations between unit discharges and theta field potentials. Exp Brain Res. 1987b;67:502–509. doi: 10.1007/BF00247283. - DOI - PubMed
    1. Boccara CN, Sargolini F, Thoresen VH, Solstad T, Witter MP, Moser EI, Moser MB. Grid cells in pre- and parasubiculum. Nat Neurosci. 2010;13:987–994. doi: 10.1038/nn.2602. - DOI - PubMed
    1. Bostock E, Muller RU, Kubie JL. Experience-dependent modifications of hippocampal place cell firing. Hippocampus. 1991;1:193–205. doi: 10.1002/hipo.450010207. - DOI - PubMed
    1. Brown JE, Skaggs WE. Concordant and discordant coding of spatial location in populations of hippocampal CA1 pyramidal cells. J Neurophysiol. 2002;88:1605–1613. - PubMed

Publication types

LinkOut - more resources