. 2013 May 29;33(22):9273-82.
doi: 10.1523/JNEUROSCI.0239-13.2013.

Attending multiple items decreases the selectivity of population responses in human primary visual cortex

Affiliations

Attending multiple items decreases the selectivity of population responses in human primary visual cortex

David E Anderson et al. J Neurosci. .

Retraction in

Abstract

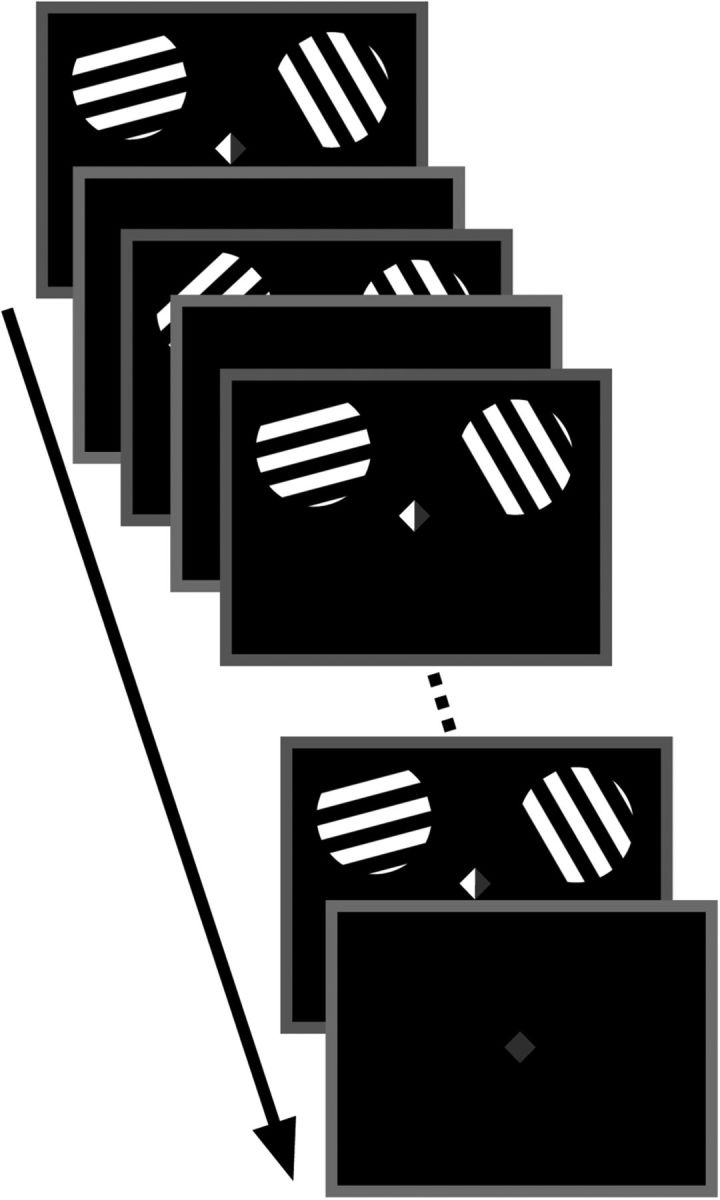
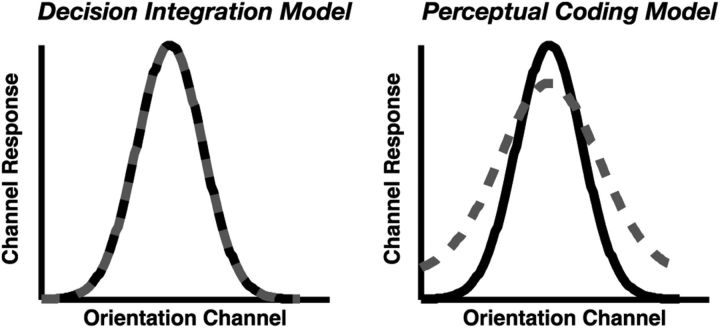
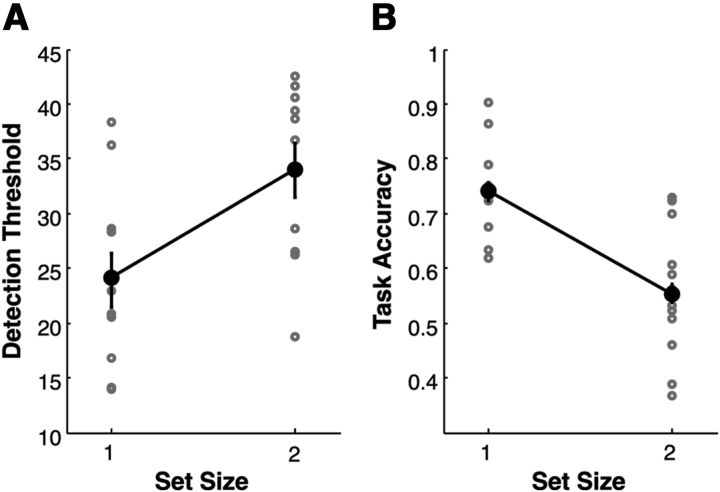
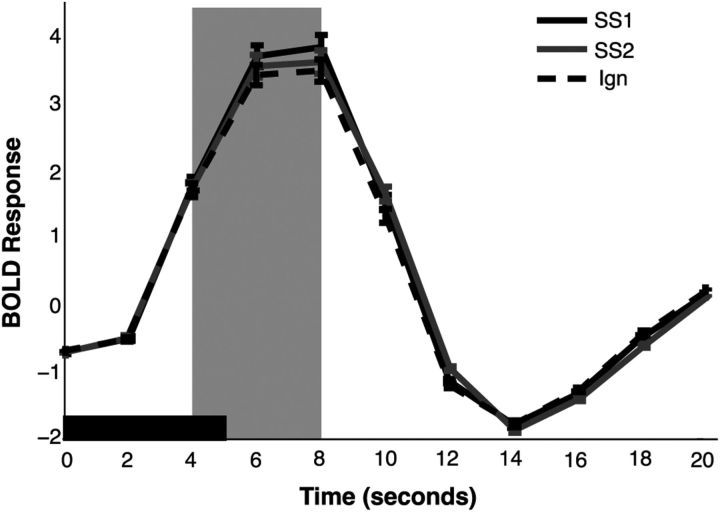
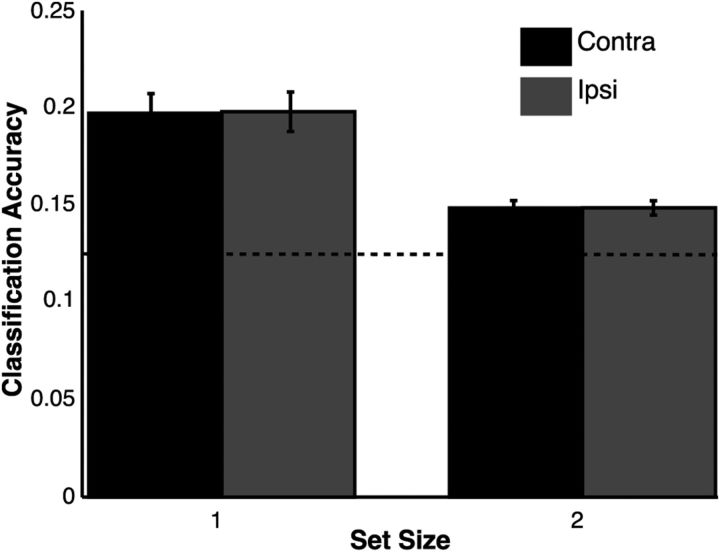
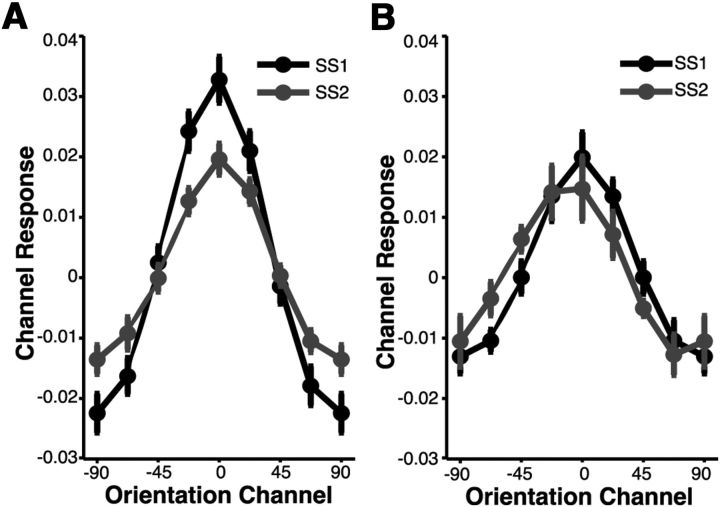
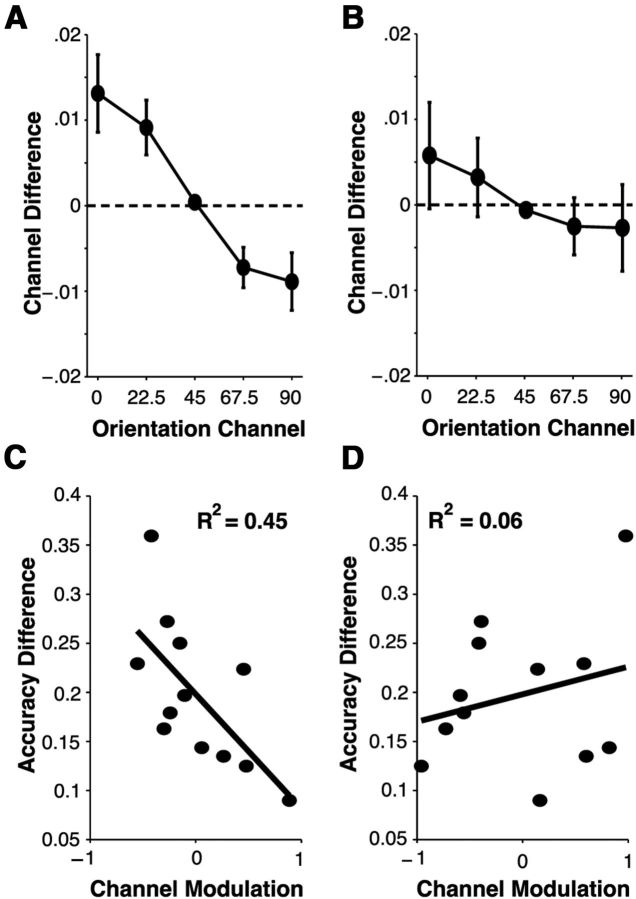
Multiple studies have documented an inverse relationship between the number of to-be-attended or remembered items in a display ("set size") and task performance. The neural source of this decline in cognitive performance is currently under debate. Here, we used a combination of fMRI and a forward encoding model of orientation selectivity to generate population tuning functions for each of two stimuli while human observers attended either one or both items. We observed (1) clear population tuning functions for the attended item(s) that peaked at the stimulus orientation and decreased monotonically as the angular distance from this orientation increased, (2) a set-size-dependent decline in the relative precision of orientation-specific population responses, such that attending two items yielded a decline in selectivity of the population tuning function for each item, and (3) that the magnitude of the loss of precision in population tuning functions predicted individual differences in the behavioral cost of attending an additional item. These findings demonstrate that attending multiple items degrades the precision of perceptual representations for the target items and provides a straightforward account for the associated impairments in visually guided behavior.


Figures

Figure 1.
Figure 1.
Behavioral task. Subjects were instructed to attend the item indicated by the central cue. During set size 1 trials, either the left or right side of the cue was shaded green, indicating that subjects were to attend only the left or right grating, respectively; during set size 2 trials, both sides of the cue were shaded. Subjects were instructed to detect angular deviations in an attended item and to indicate its direction (counterclockwise or clockwise). Stimuli oscillated (3 Hz) for 5 s, followed by a randomly jittered intertrial interval.
Figure 2.
Figure 2.
Model predictions. Predicted effect of set size on hypothetical orientation-selective population response profiles for set size 1 (black) or set size 2 (gray) displays. According to the decision integration model (left), the representational quality of each item is independent of set size, leading to no difference in population response profiles. According to the perceptual coding model (right), the quality of each item is determined by a limited neural resource, in which the resource is divided more finely among a greater number of items; consequently, this class of model predicts a decline in the selectivity of population responses.
Figure 3.
Figure 3.
Task performance. A, Performance during the staircasing procedure. Angular deviations were modulated separately for each set size, and detection thresholds were estimated as the angular deviation required to reach 75% detection accuracy. Detection thresholds were significantly lower for set size 1 trials compared with set size 2 trials (p < 0.01). B, Task performance during MRI. Angular deviations for both set sizes were yoked to detection thresholds for set size 1 during the staircasing procedure. Accuracy in reporting the direction of angular deviations was higher for set size 1 than set size 2 (p < 0.01). Error bars represent within-subject confidence intervals.
Figure 4.
Figure 4.
Event-related analysis of BOLD signal. The mean BOLD response was estimated from the 75% most selective voxels in V1 for both set sizes. The solid black window represents the duration of the stimulus display. Data are collapsed across stimulus orientation. BOLD responses were significantly higher for set size 1 (SS1) trials than set size 2 (SS2) trials during the main analysis window (gray shaded window; p < 0.01). BOLD responses were lowest for the unattended stimulus (Ign). Error bars represent between-subject confidence intervals.
Figure 5.
Figure 5.
Multivoxel decoding analysis. A classification algorithm was trained to recognize orientation-selective patterns from voxels within each V1 ROI and then inferred the orientation of the attended stimulus. The horizontal dashed line at 0.125 indicates chance classification accuracy. Above-chance classification accuracy was observed for both set sizes and ROIs (contralateral, ipsilateral). Classification accuracy was higher for set size 1 trials than set size 2 trials, although no difference was observed between ROIs within each set size. Error bars represent between-subject confidence intervals.
Figure 6.
Figure 6.
Population-level orientation-selective responses. A forward encoding model was used to generate orientation-selective population response profiles for each stimulus in the display based on patterns of activity observed in V1. This analysis revealed a similar pattern across set sizes and ROIs (contralateral, ipsilateral): a clear population tuning function emerged that peaked at the channel centered over the orientation of the stimulus and decreased monotonically as the angular distance from this orientation increased. A, Population tuning functions observed in contralateral hemisphere (collapsed across left and right hemifield stimulus presentations) for set size 1 (black; SS1) and set size 2 (gray; SS2) trials. B, Population tuning functions observed in ipsilateral hemisphere (collapsed across left and right hemifield stimulus presentations) for set size 1 and set size 2 trials.
Figure 7.
Figure 7.
Loss of feature selectivity in population responses. A, B, Channel differences were estimated by subtracting channel responses in population tuning functions observed in set size 2 trials from those observed in set size 1 trials for contralateral (A) and ipsilateral (B) hemispheres. Positive channel differences represent larger channel responses for set size 1 population tuning functions; negative channel differences represent larger channel responses for set size 2 population tuning functions. For contralateral ROIs, a loss of selectivity associated with attending multiple items was observed—represented as a reduction in on-channel responses and increase in off-channel responses for set size 2 compared with set size 1 population tuning functions—whereas no loss of selectivity was observed in ipsilateral ROIs. C, D, Individual differences in the loss of feature selectivity predict declines in behavioral performance. Differences in behavioral accuracy (set size 1 − set size 2) were plotted as a function of channel modulation in both contralateral (C) and ipsilateral (D) ROIs. For contralateral ROIs, channel modulation predicted behavioral costs in accuracy, such that a more negative slope in channel differences (A) corresponded to a larger set-size-dependent cost in accuracy (p < 0.01). This link was not observed in ipsilateral ROIs (p = 0.41).

Similar articles

Cited by

References

    1. Anderson DE, Awh E. The plateau in mnemonic resolution across large set sizes indicates discrete resource limits in visual working memory. Atten Percept Psychophys. 2012;74:891–910. doi: 10.3758/s13414-012-0292-1. - DOI - PMC - PubMed
    1. Anderson DE, Vogel EK, Awh E. Precision in visual working memory reaches a stable plateau when individual item limits are exceeded. J Neurosci. 2011;31:1128–1138. doi: 10.1523/JNEUROSCI.4125-10.2011. - DOI - PMC - PubMed
    1. Anderson DE, Vogel EK, Awh E. A common discrete resource for visual working memory and visual search. Psychol Sci. 2013 doi: 10.1177/0956797612464380. doi: 10.1177/0956797612464380. Advance online publication. Retrieved April 25, 2013. - DOI - DOI - PMC - PubMed
    1. Boynton GM, Engel SA, Glover GH, Heeger DJ. Linear systems analysis of functional magnetic resonance imaging in human V1. J Neurosci. 1996;16:4207–4221. - PMC - PubMed
    1. Brainard DH. The psychophysics toolbox. Spat Vis. 1997;10:433–436. doi: 10.1163/156856897X00357. - DOI - PubMed

Publication types

LinkOut - more resources