. 2013 May 29;33(22):9498-507.
doi: 10.1523/JNEUROSCI.5397-12.2013.

Tau accumulation activates the unfolded protein response by impairing endoplasmic reticulum-associated degradation

Affiliations

Tau accumulation activates the unfolded protein response by impairing endoplasmic reticulum-associated degradation

Jose F Abisambra et al. J Neurosci. .

Abstract

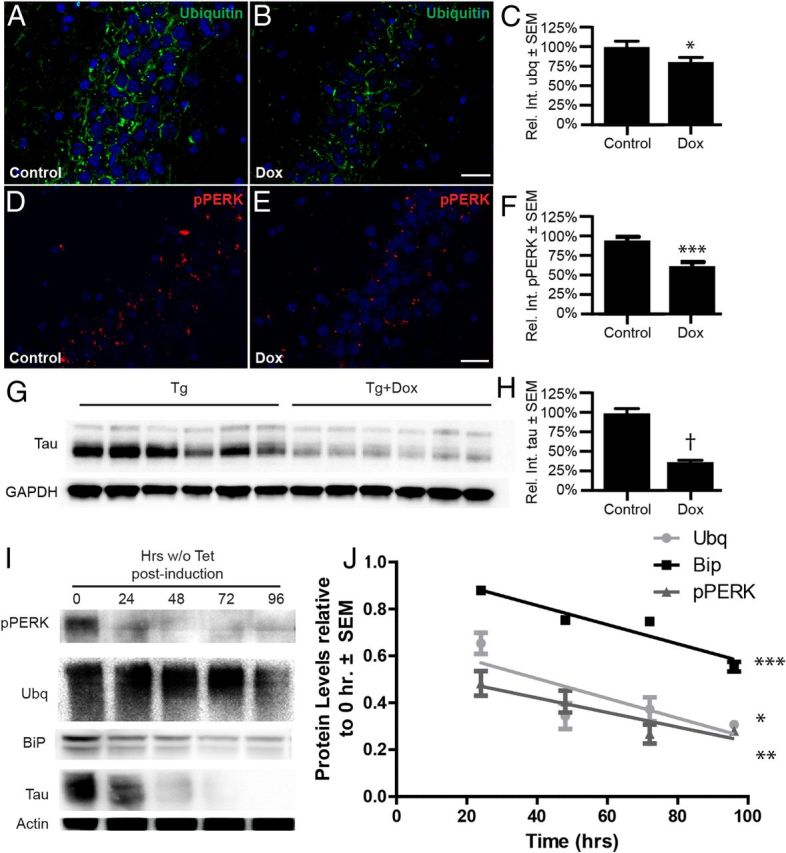
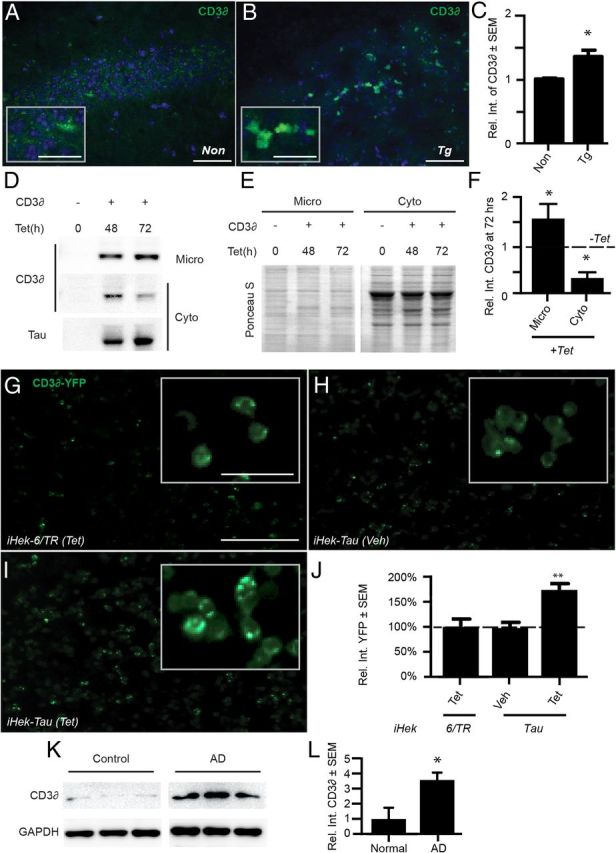
In Alzheimer's disease (AD), the mechanisms of neuronal loss remain largely unknown. Although tau pathology is closely correlated with neuronal loss, how its accumulation may lead to activation of neurotoxic pathways is unclear. Here we show that tau increased the levels of ubiquitinated proteins in the brain and triggered activation of the unfolded protein response (UPR). This suggested that tau interferes with protein quality control in the endoplasmic reticulum (ER). Consistent with this, ubiquitin was found to associate with the ER in human AD brains and tau transgenic (rTg4510) mouse brains, but this was not always colocalized with tau. The increased levels of ubiquitinated protein were accompanied by increased levels of phosphorylated protein kinase R-like ER kinase (pPERK), a marker that indicates UPR activation. Depleting soluble tau levels in cells and brain could reverse UPR activation. Tau accumulation facilitated its deleterious interaction with ER membrane and associated proteins that are essential for ER-associated degradation (ERAD), including valosin-containing protein (VCP) and Hrd1. Based on this, the effects of tau accumulation on ERAD efficiency were evaluated using the CD3δ reporter, an ERAD substrate. Indeed, CD3δ accumulated in both in vitro and in vivo models of tau overexpression and AD brains. These data suggest that soluble tau impairs ERAD and the result is activation of the UPR. The reversibility of this process, however, suggests that tau-based therapeutics could significantly delay this type of cell death and therefore disease progression.


Figures

Figure 1.
Figure 1.
Tau is correlated with accumulation of ubiquitin and activation of PERK. A, Representative Western blots of ubiquitin and pPERK and PERK in the brains of 9-month old Tg and nontransgenic (Non) controls. Tau bands confirm tau overexpression; GAPDH was used as a loading control. B, Quantification of A (n = 6 Non and n = 7 Tg; 4- and 3-fold increases of **p < 0.01 and *p < 0.05, respectively). CJ, Representative immunofluorescent microscopy images of ubiquitin (C,D; green), pPERK (E,F; red), BiP (G,H; red), and tau (I,J; green) in the hippocampus of Non (C,E,G,I) and Tg (D,F,H,J) mice. DAPI (blue) was used to identify cell nuclei. Scale bar, 20 μm. K, Graph showing quantification of immunofluorescent-positive signal in C–J. Ubiquitin, pPERK, and BiP levels in the Tg brains were increased by 3.7-fold (n = 3 Non and n = 6 Tg; ***p < 0.001), 2.4-fold (n = 3 Non and n = 5 Tg; ***p = 0.0001), and 0.3-fold (n = 5 Non and n = 4 Tg; *p < 0.05), respectively; PHF1 tau levels were virtually undetectable above background in I. Statistical significance was determined using Student's t test.
Figure 2.
Figure 2.
Increased ubiquitin precedes activation of ER stress. A, Representative Western blot of pPERK, BiP, ubiquitin, tau, and actin from iHEK-Tau cells induced to express tau by adding Tet to the media for 4 d. Samples were collected at the indicated times. B, Linear regression analysis representing the relative quantitation of pPERK, BiP, and ubiquitin levels in A over time; values are relative and normalized to GAPDH and tau. Significance was derived from four experiments; *p < 0.05, **p < 0.01, ***p < 0.001 for C, E, G. Representative immunofluorescent images of Tg hippocampi of the indicated ages and stained for ubiquitin (C; green), pPERK (E; red), and tau (G; red). Scale bar, 100 μm. D, F, H, Quantitative analysis of C, E, and G. Immunofluorescence in 3-month-old (3MO) sections was virtually undetectable above background control slide, which consisted of immunofluorescent staining without primary antibody incubation. Compared with 6MO mice, ubiquitin, pPERK, and tau levels increased by 150% (9MO; †p < 0.0001) and 186% (12MO; †p < 0.0001), 266% and 243% (9MO; †p < 0.0001), and 194% (9MO; ***p < 0.001) and 215% (12MO; ***p < 0.001), respectively. Comparing 9MO with 12MO mice, ubiquitin and tau levels were significantly different (†p < 0.0001 and ***p < 0.001, respectively), but pPERK levels were not (p > 0.05) (n = 3 mice for each condition). Statistical significance was determined using Student's t test.
Figure 3.
Figure 3.
Ubiquitin colocalizes with tau, the ER, or other proteins in Tg brains. AG, Quadruple immunofluorescent stain of tau (A,C,E,G; red), ubiquitin (B,C,F,G; green), calnexin (DG; cyan), and neurons (G; blue) in the hippocampus of 9-month-old Tg mice (low-magnification scale bar, 100 μm). Insets show higher-magnification images (inset scale bar, 10 μm). G, Inset of the merged image shows tau-ubiquitin colocalization (white arrowhead), non-colocalizing ubiquitin (yellow arrowhead), and calnexin-ubiquitin colocalization (orange arrowhead). H, Graphical representation of the amount of colocalization, where 24% and 17% of ubiquitin (top green bar) colocalizes with tau or calnexin, respectively (Pearson > 0.5); however, tau and calnexin do not colocalize (Pearson < 0.5). Approximately 59% of the ubiquitin signal did not colocalize with either tau or calnexin. Red and cyan bars show that 60% of tau and 42% of calnexin are ubiquitinated, respectively; the remainder of the signal did not colocalize with ubiquitin.
Figure 4.
Figure 4.
Ubiquitin colocalizes with tau, the ER, and other proteins in AD brains. AE, Representative quadruple immunofluorescent stain of tau (A,B,D,E; red), ubiquitin (BE; green), calnexin (A,CE; cyan), and neurons (E; blue) in an AD brain (scale bar, 5 μm). Images represent a progression of three z-stacks at 1 μm apart showing partial colocalization of ubiquitin with either tau or calnexin and that tau and calnexin do not colocalize. F, Graphical representation of the amount of colocalization in which 30% and 31% of ubiquitin (top green bar) colocalizes with tau or calnexin, respectively (Pearson > 0.5); however, tau and calnexin do not colocalize (Pearson < 0.5). The remaining ubiquitin signal did not colocalize with either tau or calnexin (∼29%). Red and cyan bars bar show that 39% of tau and 49% of calnexin are ubiquitinated, respectively. Analysis is based on images taken from 3 AD brains in Braak stage 5 or 6; multiple images were taken from each brain and three randomly selected neurons were analyzed to obtain Pearson's, Manders', and Costes' coefficients, as described in the Materials and Methods. G, Representative Western blot of ubiquitin and flotillin-1 in the microsomal fractions of medial temporal gyrus of nondemented controls and AD brains.
Figure 5.
Figure 5.
Depletion of soluble tau reverses the accumulation of ubiquitin and pPERK signal in vivo and in vitro. AH, rTg4510 mice were fed a control or Dox diet for 35 d to suppress tau transgene expression. A, B, D, E, Representative immunofluorescent images of ubiquitin (A,B; green), pPERK (D,E; red), and DAPI (blue) in the CA2 of Tg brains (scale bar, 40 μm). C, F, Graphs showing that ubiquitin and pPERK aggregates were decreased by 20% (*p < 0.05; n = 3 control and n = 4 Dox) and 37% (***p < 0.0001; n = 5 control and n = 6 Dox), respectively. G, H, Representative immunoblot of tau from brains of Dox-fed mice and controls showing that tau levels were decreased by 64% (†p < 0.0001; n = 6 for each condition). I, Representative Western blot of pPERK, BiP, ubiquitin, tau, and actin from iHEK-Tau cells. iHEK-Tau cells were induced to express tau by adding Tet to the media. After 4 d, Tet-containing medium was removed, cells were washed, and Tet-free media was added for 4 d. Cells were harvested at different time points after removing the Tet. J, Linear regression analysis showing reductions in of pPERK, BiP, and ubiquitin levels over time after Tet removal; values are relative and normalized to actin. Significance was derived from four experiments (*p < 0.05, **p < 0.01, ***p < 0.001).
Figure 6.
Figure 6.
Tau associates with the ERAD heterocomplex members VCP and Hrd1. A, Representative blots of tau and actin from iHEK-Tau cells that were induced to express tau for 96 h and fractionated to separate microsomal and cytoplasmic proteins. B, C, Representative blots from IP:WB experiments in which tau or VCP was immunoprecipitated from mouse hippocampus and samples were immunoblotted for VCP, Hrd1, and tau. The control lane corresponds to Tg lysate that was not incubated tau antibody. Input lanes show bands representative of VCP, Hrd1, tau, and GAPDH. Quantification of the input blots shows a 3-fold increase in VCP levels (n = 4 nontransgenic [Non], n = 7 Tg; *p < 0.05). DG, Representative immunofluorescent microscopy images and colocalization plots of 9MO Tg mice. DF, Sections were costained with anti-tau (green) and anti-VCP (red) antibodies and DAPI (blue) was used to identify cell nuclei. F, Colocalized signal appears in yellow of the merged images. Scale bars, 20 μm (low-magnification image) and 10 μm (insets). G, Plot confirming colocalization of signals (Pearson's coefficient > 0.9).
Figure 7.
Figure 7.
The ERAD substrate CD3δ accumulates in tau-overexpressing models and human AD brains. A, B, Representative immunofluorescent images of CA3 from nontransgenic (Non; A) or Tg (B) mice stained for CD3δ (green). DAPI (blue) was used to identify cell nuclei; scale bars, 50 μm (low-magnification images) and 25 μm (insets). C, Quantification showed a 35% increase of CD3δ-positive signal in the CA3 of Tg brains compared with Non controls (*p < 0.05, n = 3 mice for each condition). D, Representative Western blots of CD3δ and tau in iHEK-Tau cells transfected with CD3δ or control vector plasmids and treated with Tet or vehicle for 48 or 72 h. ER-containing microsomes (Micro) were isolated from cytoplasmic (Cyto) protein fractions and samples were run in separate gels. E, Ponceau S stain of C showing equal loading. F, Relative quantitation of CD3δ signal normalized to the integrated density of Ponceau S for the entire lane. Tau-expressing cells had 50% more CD3δ in the microsomal fraction and 58% less in the cytoplasmic fraction (*p < 0.05). GI, Live-cell images of iHek-6/TR and iHEK-Tau cells transfected with CD3δ-YFP and treated with Tet or vehicle for 24 h. J, Quantitation of punctate YFP signal using five 10× images from each condition (1.7-fold increase; **p < 0.001; this experiment was done in triplicate). Scale bar, 100 μm (50 μm for insets). K, L, Western blot of CD3δ in AD (stage 5 and 6) and nondemented controls (stage 1 and 2) showing a 3.5-fold increase of CD3δ in AD brains (*p < 0.05). Statistical significance was determined using Student's t test.

Comment in

References

    1. Abisambra JF, Fiorelli T, Padmanabhan J, Neame P, Wefes I, Potter H. LDLR expression and localization are altered in mouse and human cell culture models of Alzheimer's disease. PLoS One. 2010a;5:e8556. doi: 10.1371/journal.pone.0008556. - DOI - PMC - PubMed
    1. Abisambra JF, Blair LJ, Hill SE, Jones JR, Kraft C, Rogers J, Koren J, 3rd, Jinwal UK, Lawson L, Johnson AG, Wilcock D, O'Leary JC, Jansen-West K, Muschol M, Golde TE, Weeber EJ, Banko J, Dickey CA. Phosphorylation dynamics regulate Hsp27-mediated rescue of neuronal plasticity deficits in tau transgenic mice. J Neurosci. 2010b;30:15374–15382. doi: 10.1523/JNEUROSCI.3155-10.2010. - DOI - PMC - PubMed
    1. Bancher C, Brunner C, Lassmann H, Budka H, Jellinger K, Seitelberger F, Grundke-Iqbal I, Iqbal K, Wisniewski HM. Tau and ubiquitin immunoreactivity at different stages of formation of Alzheimer neurofibrillary tangles. Prog Clin Biol Res. 1989;317:837–848. - PubMed
    1. Bays NW, Wilhovsky SK, Goradia A, Hodgkiss-Harlow K, Hampton RY. HRD4/NPL4 is required for the proteasomal processing of ubiquitinated ER proteins. Mol Biol Cell. 2001;12:4114–4128. - PMC - PubMed
    1. Bennett EJ, Shaler TA, Woodman B, Ryu KY, Zaitseva TS, Becker CH, Bates GP, Schulman H, Kopito RR. Global changes to the ubiquitin system in Huntington's disease. Nature. 2007;448:704–708. doi: 10.1038/nature06022. - DOI - PubMed

Publication types

MeSH terms