Review
. 2013 Jan;3(1):201-20.
doi: 10.1002/cphy.c120010.

Renal ammonia metabolism and transport

Affiliations
Review

Renal ammonia metabolism and transport

I David Weiner et al. Compr Physiol. 2013 Jan.

Abstract

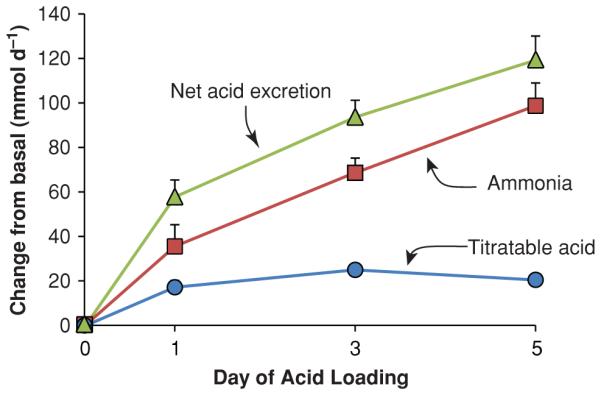
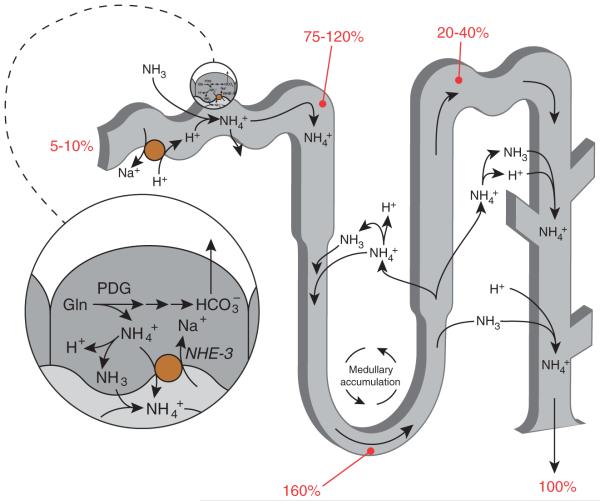
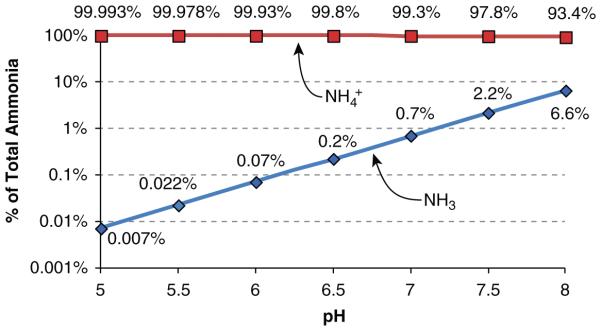
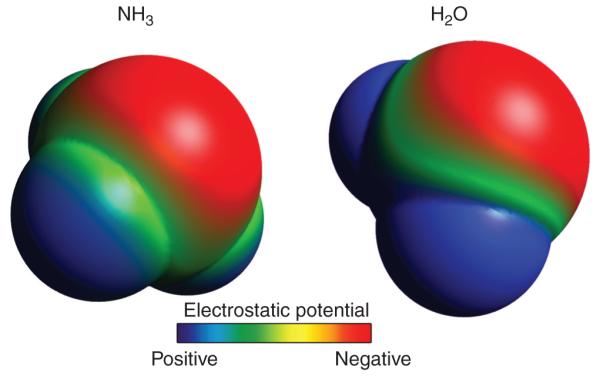
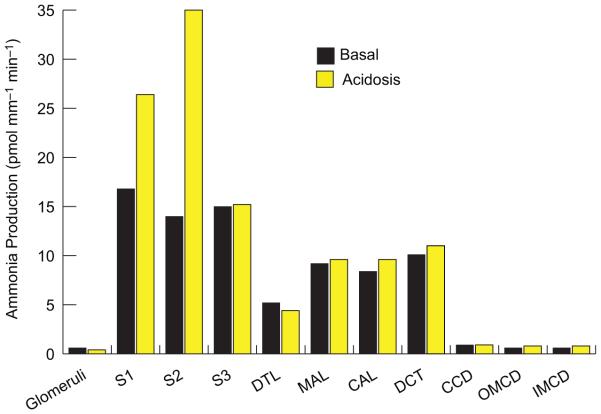
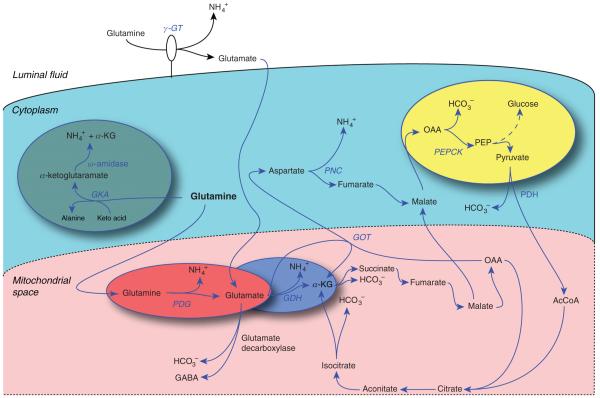
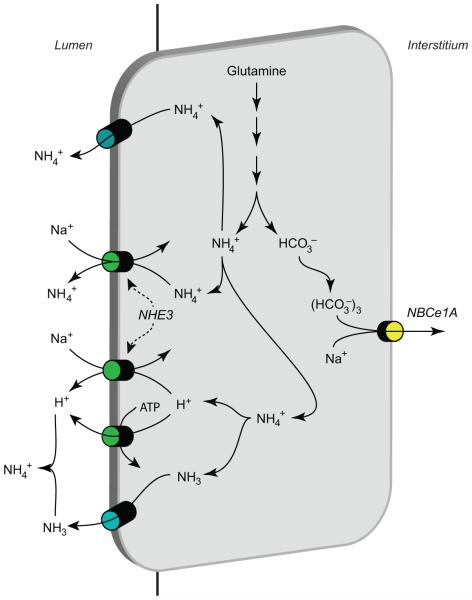
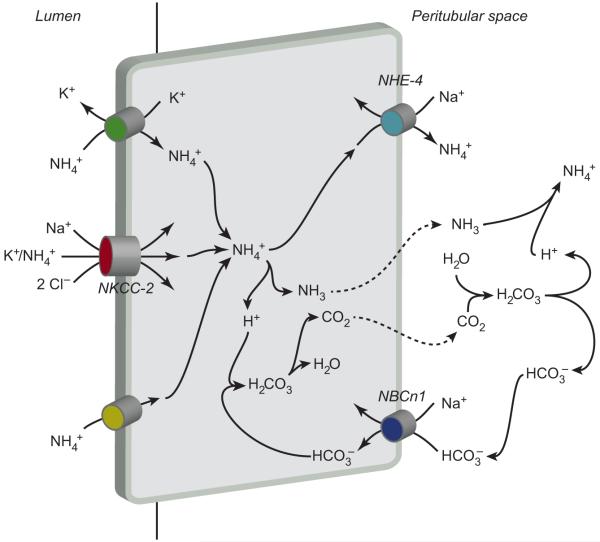
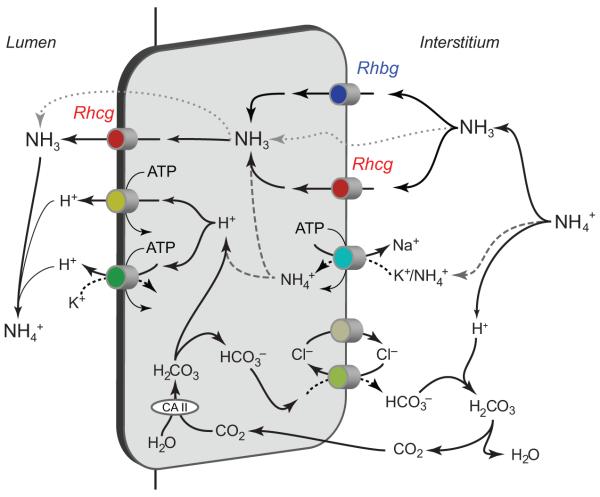
Renal ammonia metabolism and transport mediates a central role in acid-base homeostasis. In contrast to most renal solutes, the majority of renal ammonia excretion derives from intrarenal production, not from glomerular filtration. Renal ammoniagenesis predominantly results from glutamine metabolism, which produces 2 NH4(+) and 2 HCO3(-) for each glutamine metabolized. The proximal tubule is the primary site for ammoniagenesis, but there is evidence for ammoniagenesis by most renal epithelial cells. Ammonia produced in the kidney is either excreted into the urine or returned to the systemic circulation through the renal veins. Ammonia excreted in the urine promotes acid excretion; ammonia returned to the systemic circulation is metabolized in the liver in a HCO3(-)-consuming process, resulting in no net benefit to acid-base homeostasis. Highly regulated ammonia transport by renal epithelial cells determines the proportion of ammonia excreted in the urine versus returned to the systemic circulation. The traditional paradigm of ammonia transport involving passive NH3 diffusion, protonation in the lumen and NH4(+) trapping due to an inability to cross plasma membranes is being replaced by the recognition of limited plasma membrane NH3 permeability in combination with the presence of specific NH3-transporting and NH4(+)-transporting proteins in specific renal epithelial cells. Ammonia production and transport are regulated by a variety of factors, including extracellular pH and K(+), and by several hormones, such as mineralocorticoids, glucocorticoids and angiotensin II. This coordinated process of regulated ammonia production and transport is critical for the effective maintenance of acid-base homeostasis.


Figures

Figure 1
Figure 1
Relative responses of titratable acid and ammonia excretion in the response to metabolic acidosis. Normal human volunteers were acid loaded with approximately 2 mmol/kg/d of ammonium chloride and changes in urinary ammonia and titratable acid excretion were quantified. Data recalculated, with permission, from reference (36).
Figure 2
Figure 2
Summary of renal ammonia metabolism. The proximal tubule produces ammonia, as NH4+, from glutamine. NH4+ is then secreted preferentially into the luminal fluid, primarily by NHE-3, and, in addition, there is a component of NH3 secretion. Ammonia is then reabsorbed in the thick ascending limb, resulting in ammonia delivery to the distal nephron accounting for approximately 20% to 40% of final urinary ammonia. The remaining approximately 60% to 80% of urinary ammonia is secreted in the collecting duct through parallel NH3 and H+ transport. Numbers in red indicate the proportion of total urinary ammonia present at the indicated sites under baseline conditions. Figure modified from reference (180) with permission.
Figure 3
Figure 3
Relative changes in NH3 and NH4+ in solution as a function of solution pH. NH3 and NH4+ contributions to total ammonia were determined from the buffer reaction, NH3 + H+ ↔ NH4+. A pKa′ of 9.15 was used for calculations. Amounts shown are proportion of total ammonia present as NH3 and as NH4+. Note that the Y-axis is log transformed.
Figure 4
Figure 4
Space-filling model of NH3 showing molecular polarity. Space-filling model was created using Avogadro, v1.0.3, software. Surface is pseudocolored to demonstrate surface charge characteristics (red—negative, blue—positive). A similar process was used to generate space-filling model of H2O. Molecules are not drawn to scale.
Figure 5
Figure 5
Ammonia production in various renal segments. Ammonia production rates in different renal components measured in microdissected tubule segments from rats on control diets and after inducing metabolic acidosis. All segments produced ammonia. Metabolic acidosis increases total renal ammoniagenesis, but only through increased production in proximal tubule segments (S1, S2, and S3). Rates calculated from measured ammonia production rates and mean length per segment as described in (49). Size of pie graph is proportional to total renal ammoniagenesis rates. Abbreviations: DTL, descending thin limb of Henle’s loop; MAL, medullary thick ascending limb of Henle’s loop; CAL, cortical thick ascending limb of Henle’s lop; DCT, distal convoluted tubule; CCD, cortical collecting duct; OMCD, outer medullary collecting duct; IMCD, inner medullary collecting duct.
Figure 6
Figure 6
Mechanisms of ammoniagenesis. Multiple pathways for enzymatic ammonia production originating from glutamine metabolism are present in the proximal tubule. Glutamine metabolism through phosphate-dependent glutaminase (PDG) and glutamate dehydrogenase (GDH) and involving phosphoenolpyruvate carboxykinase (PEPCK) is the quantitatively most significant component of renal ammoniagenesis and the primary pathway stimulated in response to metabolic acidosis.
Figure 7
Figure 7
Ammonia transport in the proximal tubule. Ammonia is produced in the proximal tubule primarily from metabolism of glutamine, and occurs primarily in the mitochondria. The enzymatic details of ammoniagenesis are not shown. Three transport mechanisms appear to mediate preferential apical ammonia secretion. These include Na+/NH4+ exchange via NHE-3, parallel NH3 secretion and NHE-3-mediated Na+/H+ exchange, and a Ba2+-sensitive NH4+ conductance likely mediated by apical K+ channels. Secreted NH3 is titrated to NH4+ by reaction with H+, which is secreted either by NHE-3 or by apical H+-ATPase. HCO3 is produced in equimolar amounts as NH4+ in the process of ammoniagenesis, and is primarily transported across the basolateral plasma membrane by NBCe1. Minor components of basolateral NH4+ uptake via Na+-K+-ATPase and by basolateral K+ channels are not shown. Figure modified from reference (180) with permission.
Figure 8
Figure 8
Ammonia transport in the thick ascending limb (TAL). The primary mechanism of ammonia reabsorption in the TAL is via substitution of NH4+ for K+ and transport by Na+-K+-2Cl cotransporter 2 (NKCC-2). Electroneutral K+/NH4+ exchange and conductive K+transport are also present, but quantitatively less significant components of apical K+ transport. Diffusive NH3 transport across the apical plasma membrane is present, but not quantitatively significant. Cytosolic NH4+ can exit via basolateral NHE-4. A second mechanism of basolateral NH4+ exit may involve dissociation to NH3 and H+, with NH3 exit via an uncharacterized, presumably diffusive, mechanism, and buffering of intracellular H+ released via NBCn1-mediated HCO3− entry. Figure modified from reference (180) with permission.
Figure 9
Figure 9
Ammonia transport in the collecting duct. Interstitial NH4+ is in equilibrium with NH3 and H+. NH3 is transported across the basolateral membrane, predominantly by Rhcg, but also possibly partly by Rhbg. In the inner medullary collecting duct, basolateral Na+-K+-ATPase transports NH4+. Intracellular NH3 is secreted across the apical membrane by apical Rhcg. H+-ATPase and H+-K+-ATPase secrete H+, which combines with luminal NH3 to form NH4+ which is “trapped” in the lumen. Intracellular H+ is generated by CA II-accelerated CO2 hydration that forms carbonic acid, which dissociates to H+ and HCO3. Basolateral Cl/HCO3 exchange transports HCO3 across the basolateral membrane; HCO3 combines with H+ released from NH4+ to form carbonic acid, which dissociates to CO2 and water. This CO2 can recycle into the cell, supplying the CO2 used for cytosolic H+ production. The net result is NH4+ transport from the peritubular space into the luminal fluid. Figure modified from reference (180) with permission.

References

    1. Adam W, Simpson DP. Glutamine transport in rat kidney mitochondria in metabolic acidosis. J Clin Invest. 1974;54:165. - PMC - PubMed
    1. Adam WR, Koretsky AP, Weiner MW. 31P-NMR in vivo measurement of renal intracellular pH: Effects of acidosis and K+ depletion in rats. Am J Physiol. 1986;251:F904–F910. - PubMed
    1. Adam WR, Simpson DP. Renal mitochondrial glutamine metabolism and dietary potassium and protein content. Kidney Int. 1975;7:325–330. - PubMed
    1. Adrogue HJ. Glucose homeostasis and the kidney. Kidney Int. 1992;42:1266–1282. - PubMed
    1. Alleyne GA, Barnswell J, McFarlane-Anderson N, Alexander JE. Renal ammoniagenic factor in the plasma of rats with acute metabolic acidosis. Am J Physiol. 1981;241:F112–F116. - PubMed

Publication types

LinkOut - more resources