. 2013 Jun 11;110(24):9885-90.
doi: 10.1073/pnas.1301799110. Epub 2013 May 29.

Aire-expressing thymic medullary epithelial cells originate from β5t-expressing progenitor cells

Affiliations

Aire-expressing thymic medullary epithelial cells originate from β5t-expressing progenitor cells

Izumi Ohigashi et al. Proc Natl Acad Sci U S A. .

Abstract

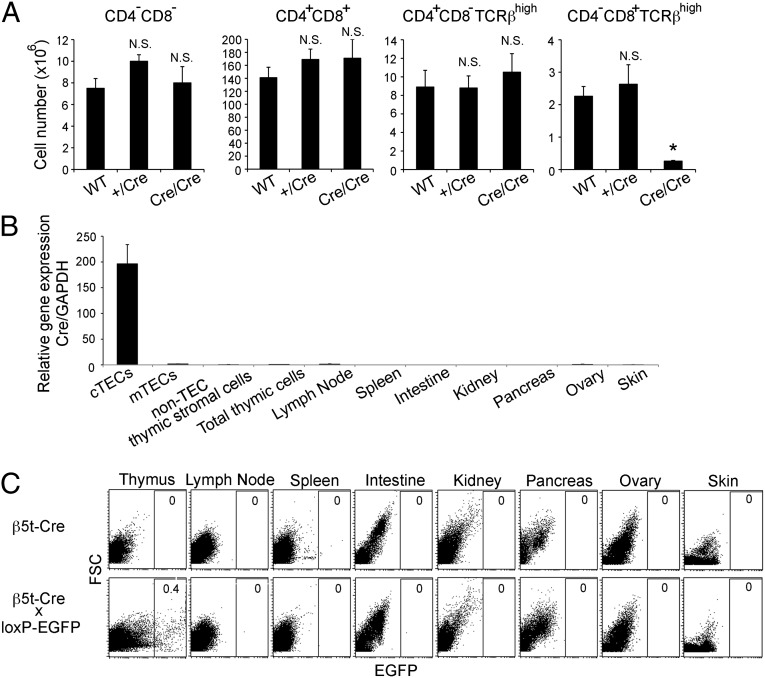
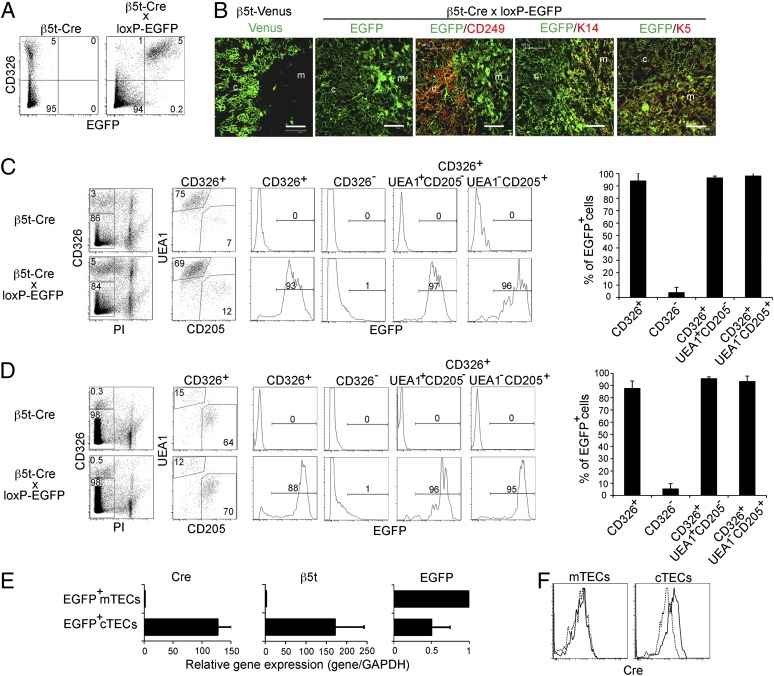
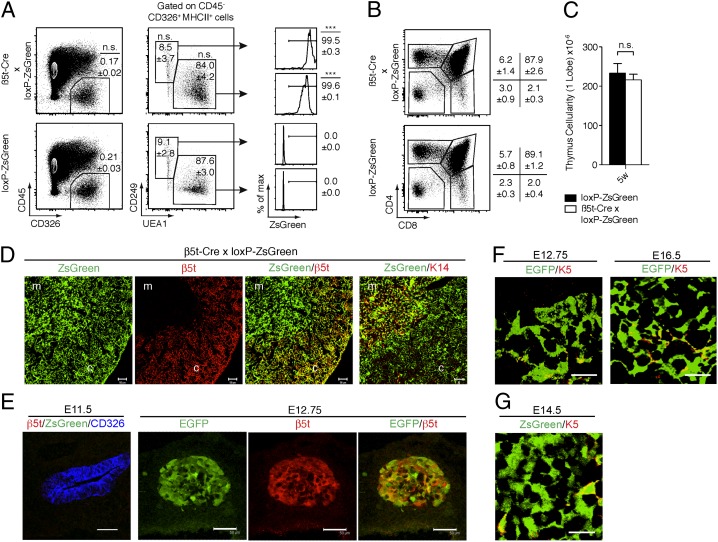
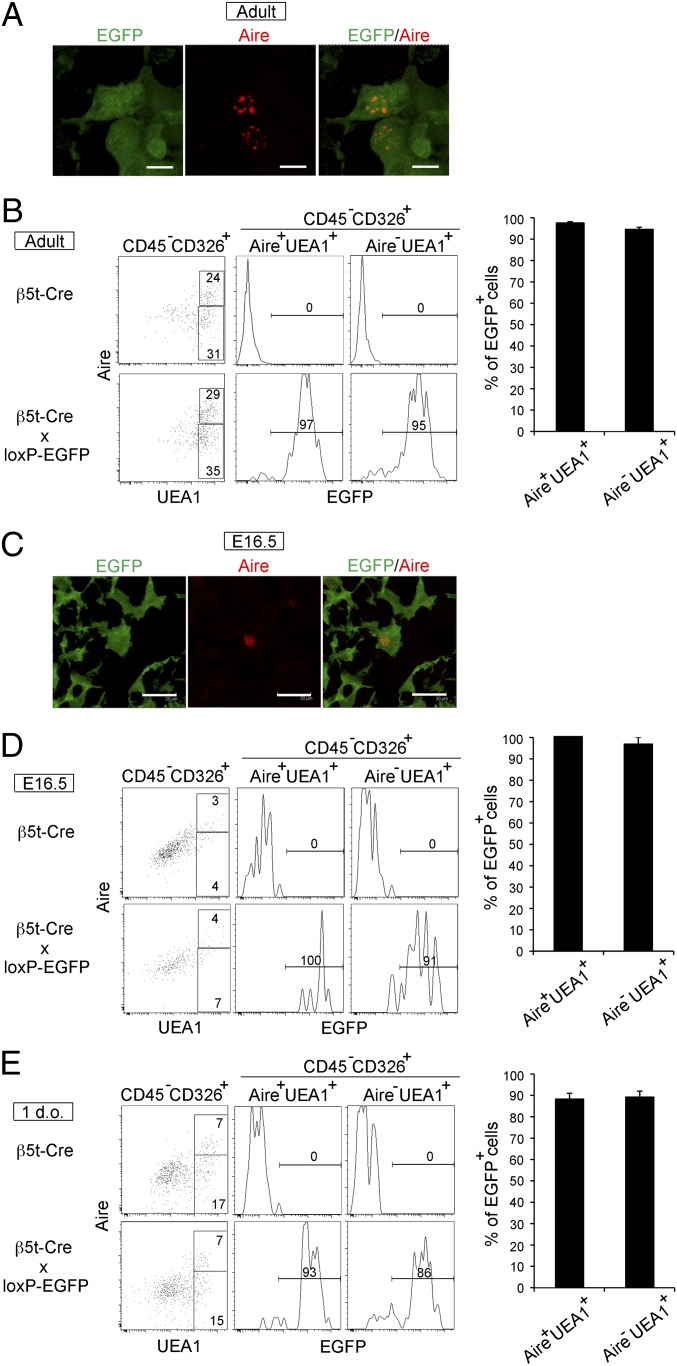
The thymus provides multiple microenvironments that are essential for the development and repertoire selection of T lymphocytes. The thymic cortex induces the generation and positive selection of T lymphocytes, whereas the thymic medulla establishes self-tolerance among the positively selected T lymphocytes. Cortical thymic epithelial cells (cTECs) and medullary TECs (mTECs) constitute the major stromal cells that structurally form and functionally characterize the cortex and the medulla, respectively. cTECs and mTECs are both derived from the endodermal epithelium of the third pharyngeal pouch. However, the molecular and cellular characteristics of the progenitor cells for the distinct TEC lineages are unclear. Here we report the preparation and characterization of mice that express the recombinase Cre instead of β5t, a proteasome subunit that is abundant in cTECs and not detected in other cell types, including mTECs. By crossing β5t-Cre knock-in mice with loxP-dependent GFP reporter mice, we found that β5t-Cre-mediated recombination occurs specifically in TECs but not in any other cell types in the mouse. Surprisingly, in addition to cTECs, β5t-Cre-loxP-mediated GFP expression was detected in almost all mTECs. These results indicate that the majority of mTECs, including autoimmune regulator-expressing mTECs, are derived from β5t-expressing progenitor cells.


Conflict of interest statement

The authors declare no conflict of interest.

Figures

Fig. 1.
Fig. 1.
β5t-Cre knock-in mice. (A) Numbers (means and SEs, n = 3) of CD4CD8, CD4+CD8+, CD4+CD8 TCRβhigh, and CD4CD8+ TCRβhigh thymocytes in 4-wk-old WT (+/+) and β5t-Cre knock-in heterozygous (+/Cre) and homozygous (Cre/Cre) mice. *P < 0.005; N.S., not significant. (B) Relative mRNA expression of Cre in indicated cells and organs isolated from 4- to 5-wk-old β5t-Cre knock-in heterozygous mice. The expression levels (means and SEs, n = 3) of Cre measured by quantitative RT-PCR were normalized to that of GAPDH and compared with the level measured in total thymic cells. (C) Representative flow cytometry profiles of forward scatter intensity and EGFP expression in collagenase-digested cells obtained from indicated tissues of 4- to 5-wk-old β5t-Cre knock-in mice and β5t-Cre x loxP-EGFP mice. Numbers indicate frequency of EGFP+ cells in total cells. n = 3.
Fig. 2.
Fig. 2.
β5t-Cre-loxP–mediated GFP expression is detected in mTECs and cTECs. (A) Representative flow cytometry profiles of CD326 and EGFP expression in collagenase-digested thymic cells from 6- to 7-wk-old mice. Thymocytes were depleted from the thymic cells by using magnetic bead–conjugated anti-CD45 antibody. Numbers indicate frequency of cells within indicated areas. n = 3. (B) Cryosections of the thymus from 6- to 7-wk-old β5t-Venus mice and β5t-Cre × loxP-EGFP mice were analyzed by confocal microscopy. Venus expression and EGFP expression are shown in green. Where indicated, the sections were also stained for CD249 (Ly51), keratin 14 (K14), or keratin 5 (K5) (red). c, cortex; m, medulla. (Scale bar: 75 μm.) Representative results are shown (n = 3). (C and D) Collagenase-digested thymic cells from indicated mice were stained with CD326 antibody and propidium iodide (PI) to identify CD326+PI viable TECs (Left). EGFP expression on CD326+ TECs, CD326 non-TEC thymic cells, CD326+UEA1+CD205 mTECs, and CD326+UEA1CD205+ cTECs from 6- to 7-wk-old (C) and 0-d-old (D) mice (Center). Numbers in dot plots and histograms indicate frequency within indicated area. Frequencies (means and SEs, n = 3) of EGFP+ cells within indicated cell populations (Right). (E) The amounts of Cre, β5t, and EGFP mRNAs in EGFP+CD326+UEA1+CD205 mTECs and EGFP+CD326+UEA1CD205+ cTECs obtained from 2- to 3-wk-old β5t-Cre × loxP-EGFP mice were measured by quantitative RT-PCR analysis and were normalized to the amount of GAPDH mRNAs. Data represent means and SEs of three independent measurements. (F) Flow cytometric analysis of Cre expression in CD45CD326+CD80+CD249 mTECs and CD45CD326+CD80CD249+ cTECs from 1-wk-old β5t-Cre mice (solid line) or WT mice (dashed line). Data are representative of three independent experiments.
Fig. 3.
Fig. 3.
β5t-Cre-knock-in locus allows faithful monitoring of present and past β5t expression. (A) Flow cytometric analysis of CD45 CD326+ MHC class II+ TEC subpopulations from 6-wk-old β5t-Cre × loxP-ZsGreen and loxP-ZsGreen mice. Relative frequencies (means and SEs, n = 3) of all TECs, UEA1CD249+ cTECs, and UEA1+CD249 mTECs are indicated in dot plots. Histograms display frequencies (means and SEs, n = 3) of ZsGreen-positive cTECs and mTECs. ***P < 0.001; n.s., not significant (comparison between β5t-Cre × loxP-ZsGreen and loxP-ZsGreen cells). (B) Flow cytometric analysis of thymocytes for the cell surface expression of CD4 and CD8. The cells were isolated from 6-wk-old loxP-ZsGreen and β5t-Cre × loxP-ZsGreen mice. Numbers denote frequency of cells within indicated gates (means and SEs, n = 3). (C) Total cellularity (means and SEs, n = 3) of the thymus in 5-wk-old loxP-ZsGreen (black bar) and β5t-Cre x loxP-ZsGreen (white bar) mice. n.s., not significant. (D) Immunofluorescence analysis of thymus tissues from 6-wk-old β5t-Cre x loxP-ZsGreen mice for the expression of ZsGreen (green), β5t (identifying cTEC, red) and K14 (detecting mTECs, red). Data are representative of at least two separate experiments using two mice each. (Scale bar: 50 μm.) c, cortex; m, medulla. (E) E11.5 embryos of β5t-Cre × loxP-ZsGreen mice and E12.75 embryos of β5t-Cre × loxP-EGFP mice were stained with anti-β5t antibody. ZsGreen or EGFP fluorescence (green) and anti-β5t immunofluorescence (red) in the pharyngeal region containing the thymic primordium were measured. Where indicated, the sections were additionally stained with anti-CD326 antibody (blue). Shown are representative results of three independent experiments. (Scale bar: 50 μm.) (F) E12.75 embryos and E16.5 embryonic thymuses of β5t-Cre × loxP-EGFP mice were stained with anti-K5 antibody. Shown are representative results (n = 3) of EGFP fluorescence (green) and anti-K5 immunofluorescence (red) of the thymic primordium (E12.75) and the thymus (E16.5). (Scale bar: 20 μm.) (G) E14.5 embryonic thymuses of β5t-Cre × loxP-ZsGreen mice were stained with anti-K5 antibody. Representative results of ZsGreen fluorescence (green) and anti-K5 immunofluorescence (red) are shown (n = 2). (Scale bar: 20 μm.)
Fig. 4.
Fig. 4.
β5t-mediated GFP expression is detected in the majority of Aire+ mTECs. Cryosections of the thymus from 6- to 7-wk-old (A) and E16.5 (C) β5t-Cre × loxP-EGFP mice were analyzed by confocal microscopy. (Scale bars: A, 7 μm; C, 20 μm.) Representative images of EGFP (green) and Aire (red) are shown (n = 3). (B, D, and E) Representative flow cytometry profiles of EGFP expression in CD45CD326+Aire+UEA1+ and CD45CD326+AireUEA1+ cells from indicated mice at 5–6 wk old (B), E16.5 (D), and 1 d old (E). Numbers in plots indicate frequency within indicated area. Frequencies of EGFP+ cells within CD45CD326+Aire+UEA1+ and CD45CD326+AireUEA1+ cells are plotted (means and SEs, n = 3).

References

    1. Manley NR, Blackburn CC. A developmental look at thymus organogenesis: Where do the non-hematopoietic cells in the thymus come from? Curr Opin Immunol. 2003;15(2):225–232. - PubMed
    1. Boehm T. Thymus development and function. Curr Opin Immunol. 2008;20(2):178–184. - PubMed
    1. Rodewald HR. Thymus organogenesis. Annu Rev Immunol. 2008;26:355–388. - PubMed
    1. Klein L, Hinterberger M, Wirnsberger G, Kyewski B. Antigen presentation in the thymus for positive selection and central tolerance induction. Nat Rev Immunol. 2009;9(12):833–844. - PubMed
    1. Anderson G, Takahama Y. Thymic epithelial cells: Working class heroes for T cell development and repertoire selection. Trends Immunol. 2012;33(6):256–263. - PubMed

Publication types

MeSH terms

LinkOut - more resources