Review
. 2013 Apr;3(2):741-83.
doi: 10.1002/cphy.c110054.

Comparative digestive physiology

Affiliations
Review

Comparative digestive physiology

William H Karasov et al. Compr Physiol. 2013 Apr.

Abstract

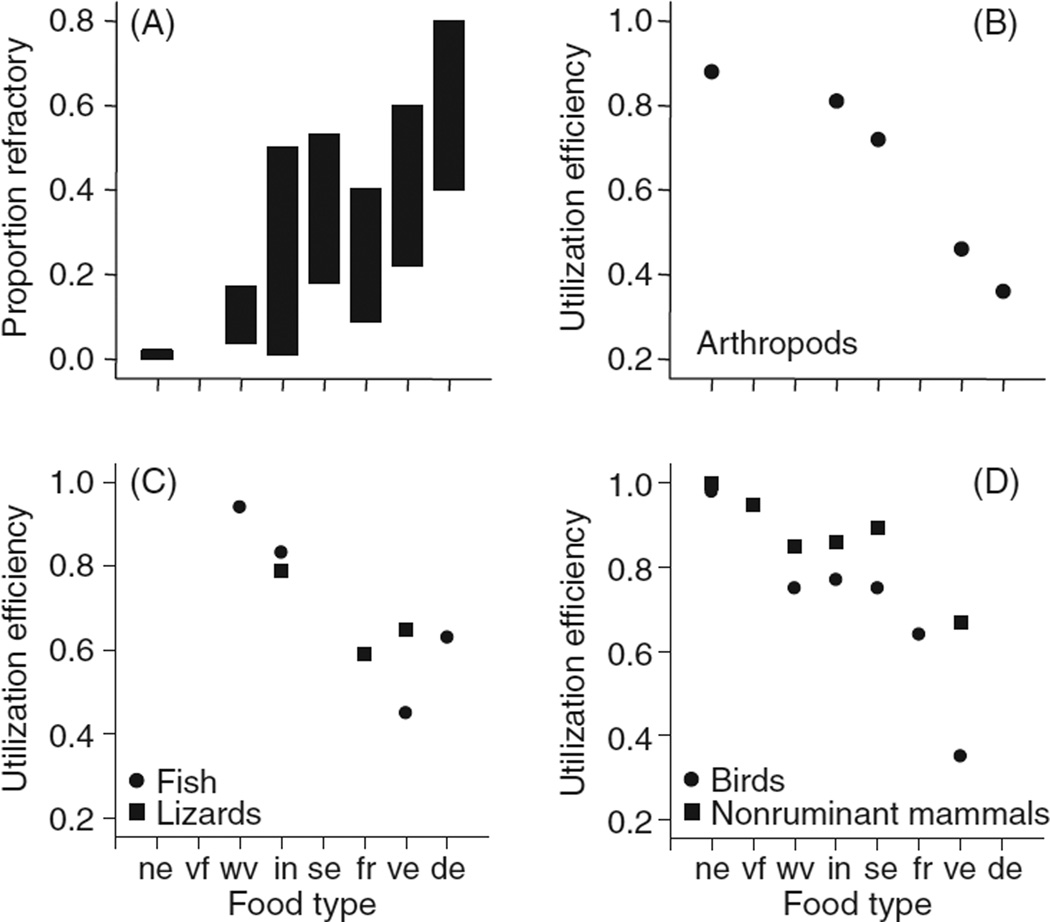
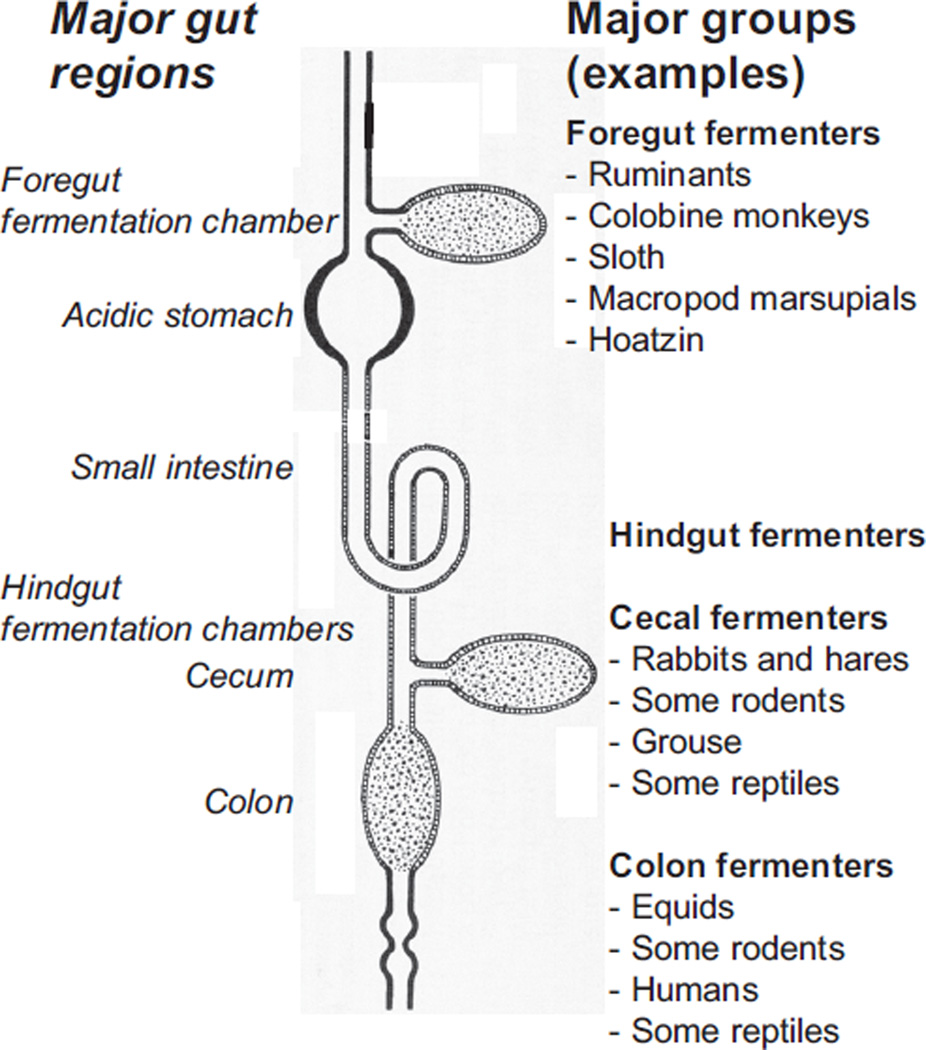
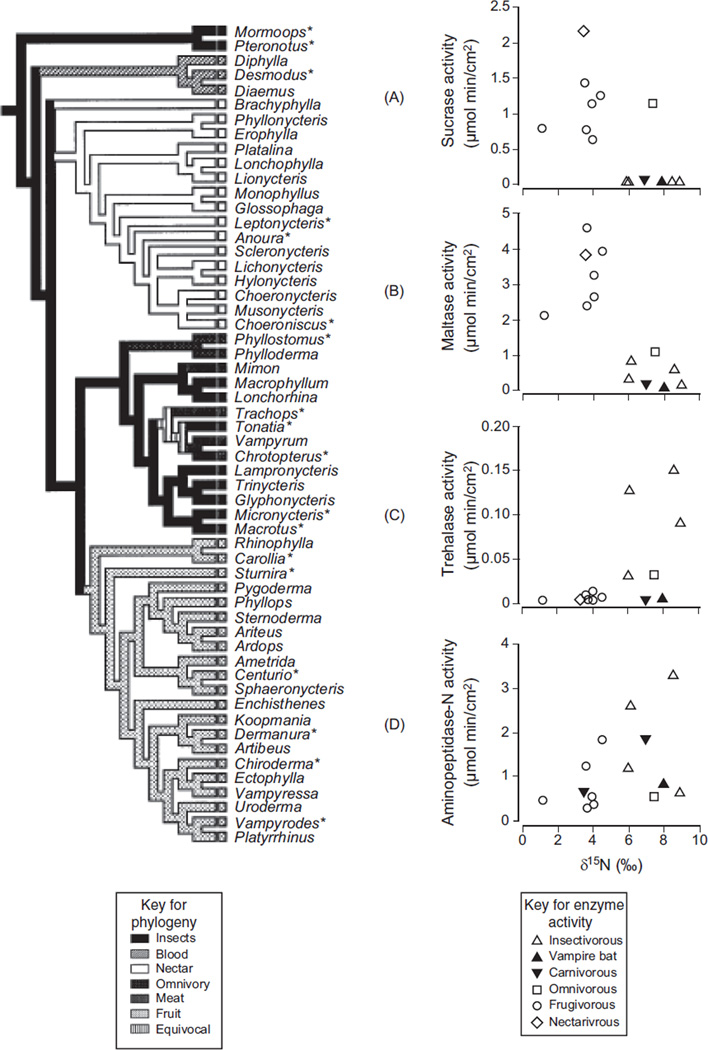
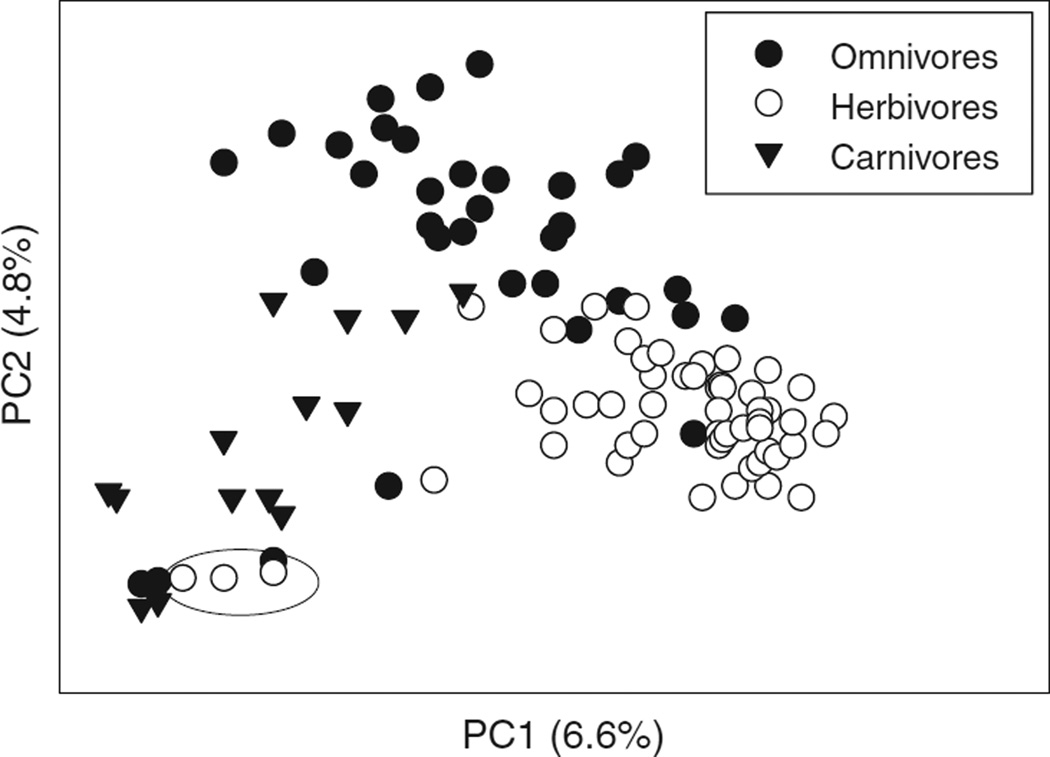
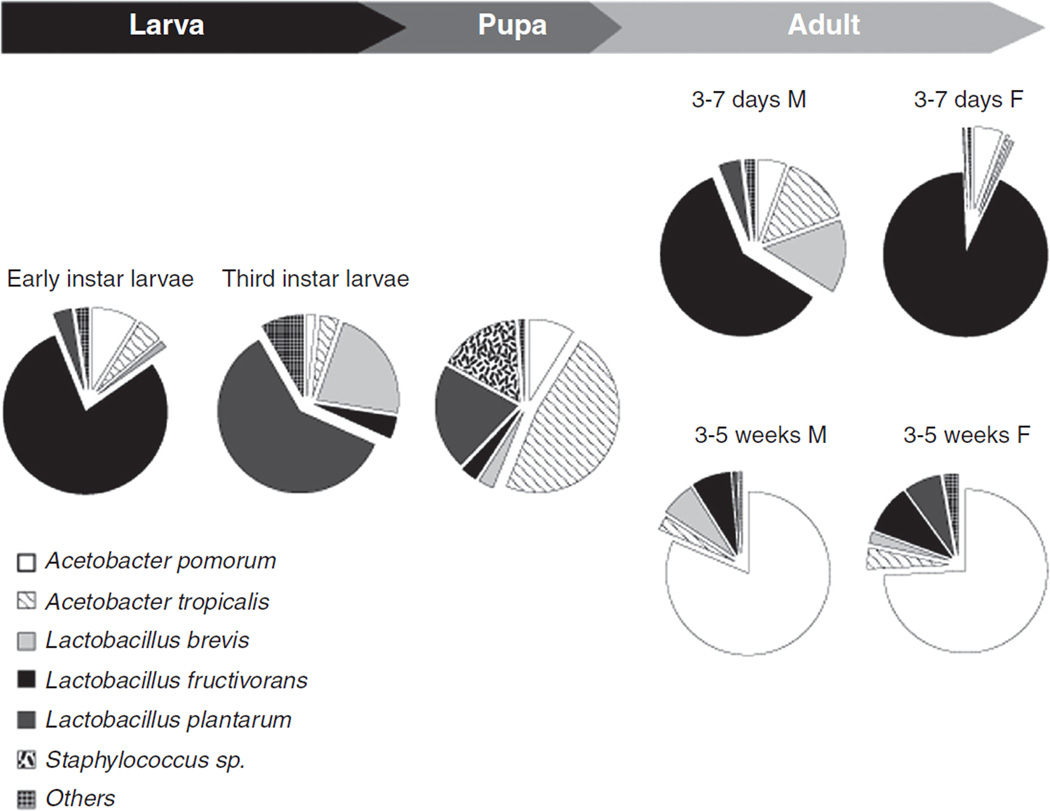
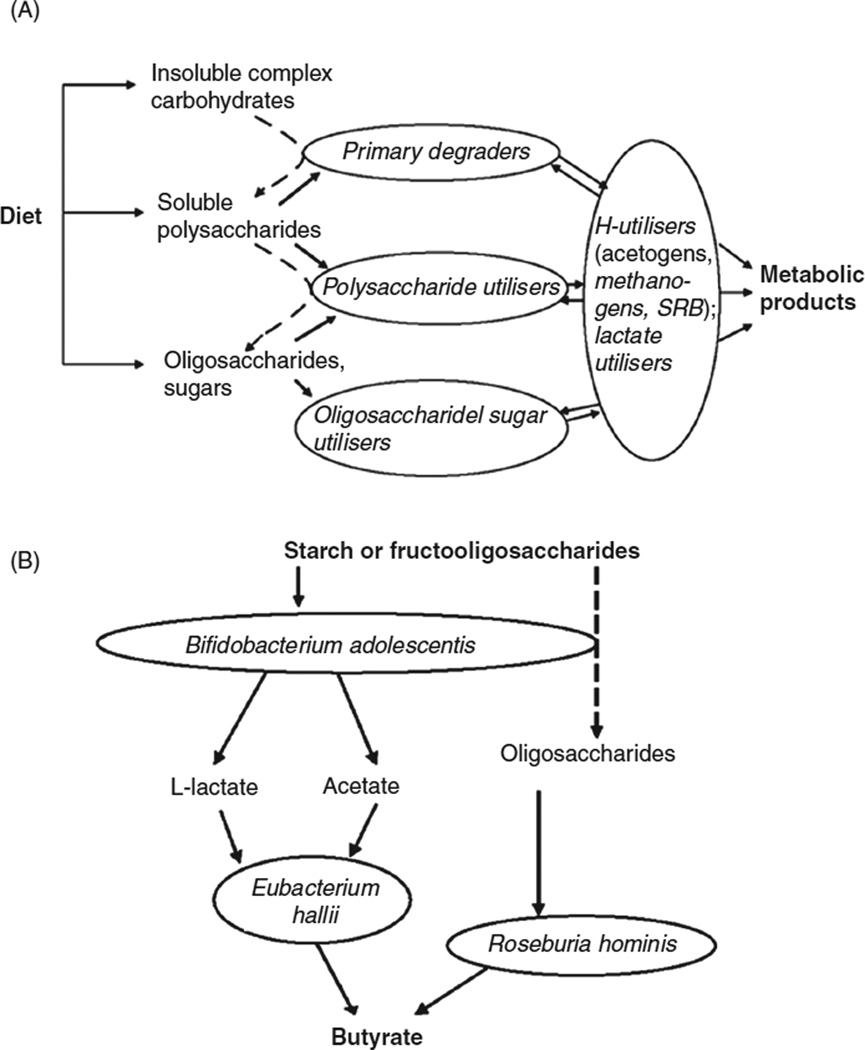
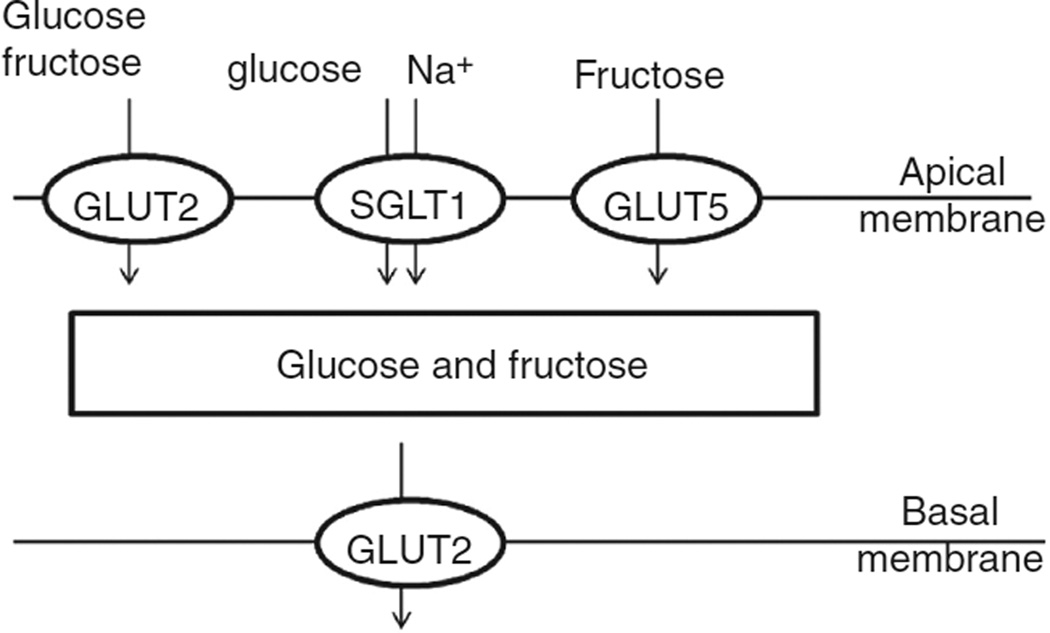
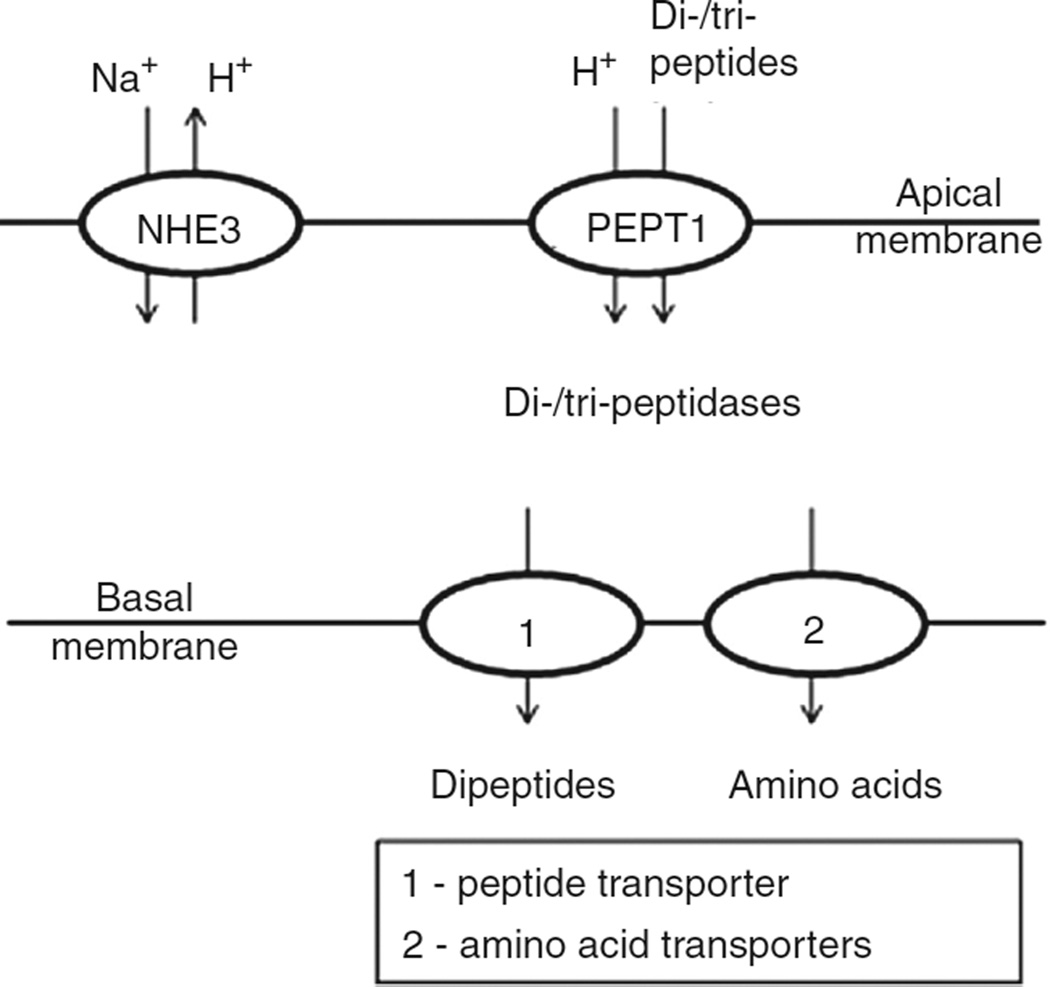
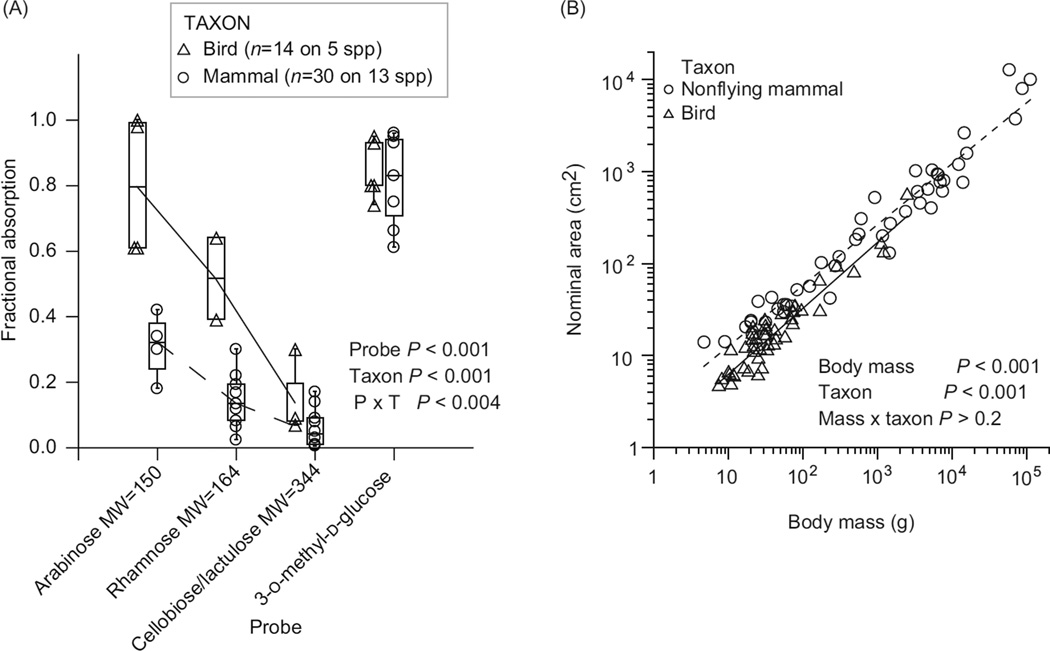
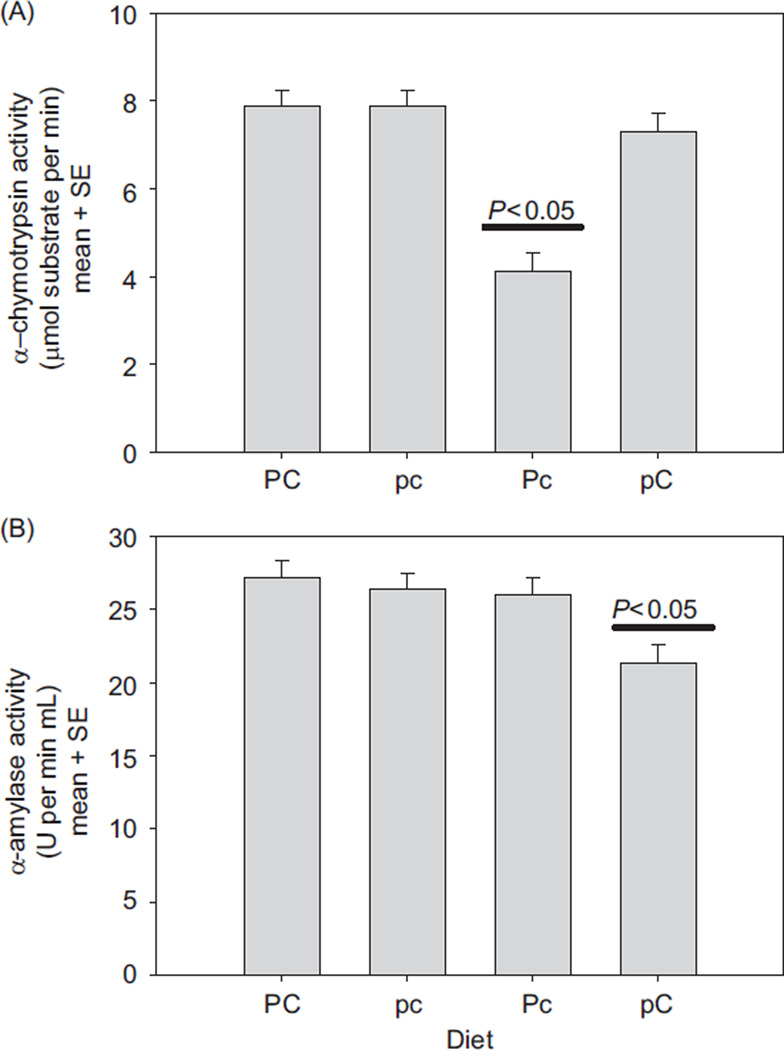
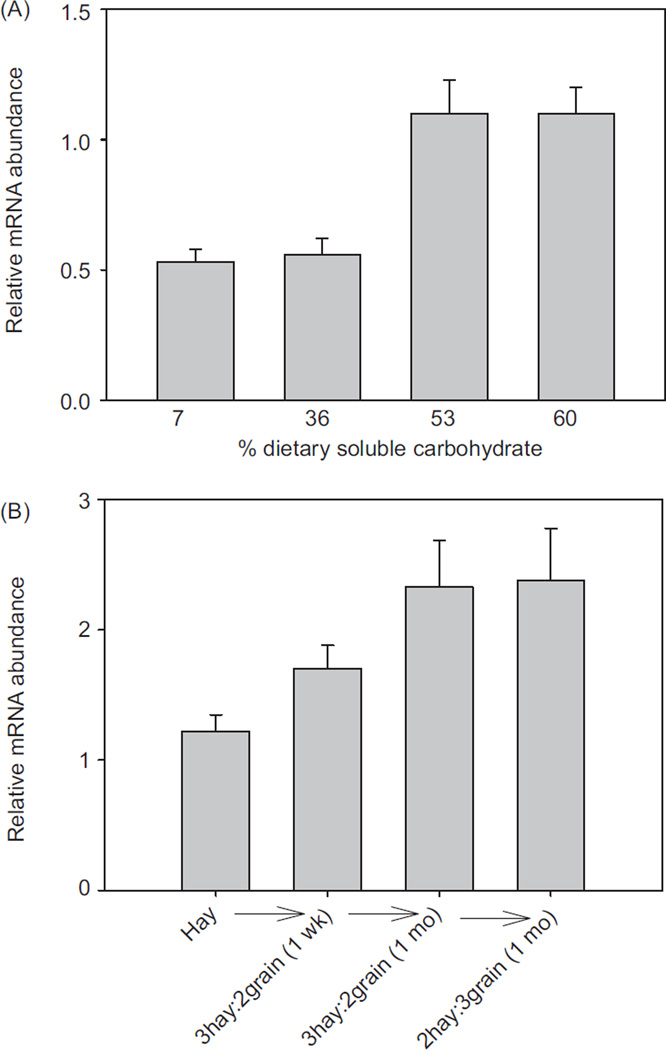
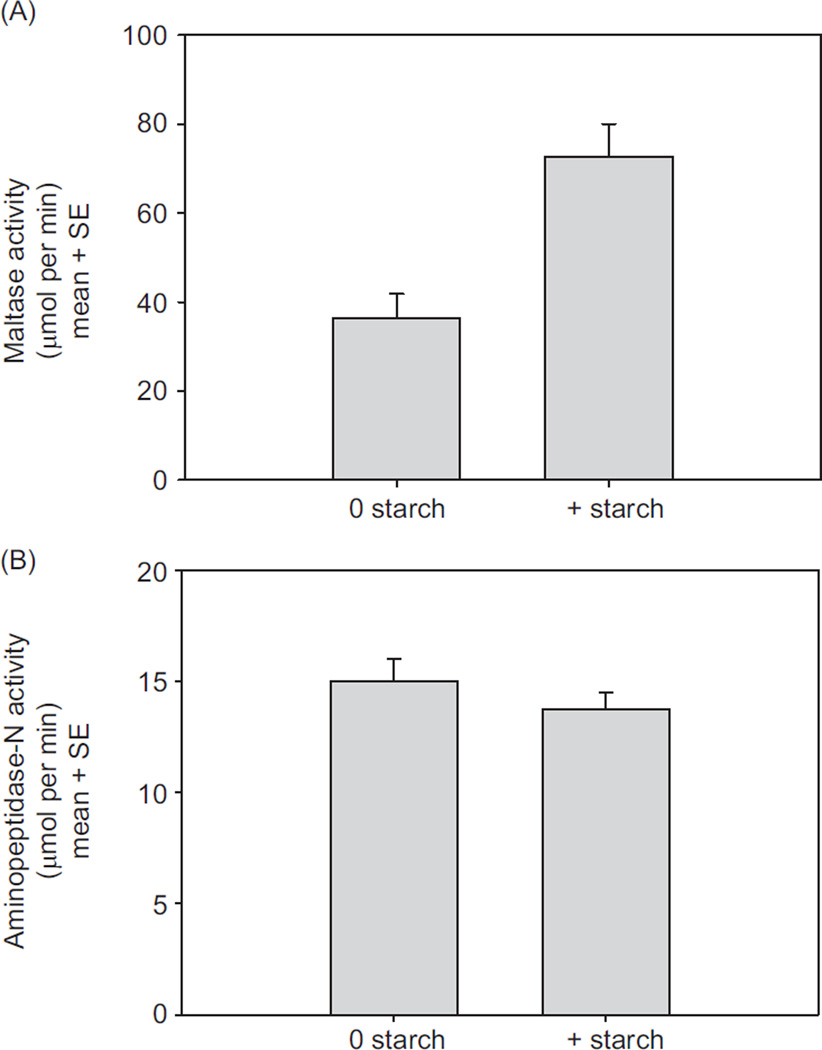
In vertebrates and invertebrates, morphological and functional features of gastrointestinal (GI) tracts generally reflect food chemistry, such as content of carbohydrates, proteins, fats, and material(s) refractory to rapid digestion (e.g., cellulose). The expression of digestive enzymes and nutrient transporters approximately matches the dietary load of their respective substrates, with relatively modest excess capacity. Mechanisms explaining differences in hydrolase activity between populations and species include gene copy number variations and single-nucleotide polymorphisms. Transcriptional and posttranscriptional adjustments mediate phenotypic changes in the expression of hydrolases and transporters in response to dietary signals. Many species respond to higher food intake by flexibly increasing digestive compartment size. Fermentative processes by symbiotic microorganisms are important for cellulose degradation but are relatively slow, so animals that rely on those processes typically possess special enlarged compartment(s) to maintain a microbiota and other GI structures that slow digesta flow. The taxon richness of the gut microbiota, usually identified by 16S rRNA gene sequencing, is typically an order of magnitude greater in vertebrates than invertebrates, and the interspecific variation in microbial composition is strongly influenced by diet. Many of the nutrient transporters are orthologous across different animal phyla, though functional details may vary (e.g., glucose and amino acid transport with K+ rather than Na+ as a counter ion). Paracellular absorption is important in many birds. Natural toxins are ubiquitous in foods and may influence key features such as digesta transit, enzymatic breakdown, microbial fermentation, and absorption.


Figures

Figure 1
Figure 1
As a general rule, digestive efficiency on a food type declines with increasing amount of refractory material in food. (A) Food types can be ranked according to their relative content of refractory material, which in this case is based largely on neutral detergent fiber (248). Ranges are given for the following food types: ne, nectar; vf, vertebrate flesh; wv, whole vertebrates; in, whole invertebrates; se, seeds; fr, fruit; ve, vegetation (grass, dicot leaves, and twigs); de, detritus. (B-D) Mean utilization efficiencies for animals in different taxa eating different types of food. The data sources and sample sizes for mammals, birds, and lizards are from (315), for immature arthropods, with permission, from reference (410), and for fish, with permission, from reference (37, 40). The efficiencies plotted in figure B–D are a mix of values of dry matter and energy digestibilities, but these measures tend to be close to each other and highly correlated (248).
Figure 2
Figure 2
Basic design of vertebrate gut. All vertebrates have a small intestine, but vary as to whether they possess other compartments such as crop, forestomach, stomach, cecum, and large intestine/colon. As a general rule, catalytic enzymatic reactions occur in the small intestine, whereas microbial fermentation can occur in the forestomach, cecum, and large intestine/colon (shown with dotted areas). Foregut fermentation occurs in four major clades of mammals and in at least one avian species (the hoatzin). Hindgut fermentation, either in the cecum or large intestine/colon, occurs in many clades of mammals, birds, and reptiles.
Figure 3
Figure 3
Pathways of amino acid recycling depend on gut design and animal behavior. In foregut fermenting herbivores (top schematic), ingested sources of nitrogen (N) can be incorporated into host protein as essential amino acids such as lysine because the microbes can synthesize this amino acid (the vertebrate host cannot). The host breaks down the microbial wall with lysozyme and digestion and absorption of microbial protein occurs in the small intestine, followed by absorption of the amino acid, which enters the host’s amino acid pool. In hindgut fermenters (lower figure), such recycling can occur if the host reingests the feces (called coprophagy or cecotrophy), breaks down the microbes perhaps with intestinal lysozyme, and then digests and absorbs microbial protein that contains the new essential amino acids. Many details remain to be elaborated, such as the location and magnitude of lysozyme capacity. Also, work with pigs (438) and humans (168) that do not reingest feces demonstrates that there is another unknown pathway for absorption of microbially produced essential nutrients.
Figure 4
Figure 4
When digestive features are not well matched to dietary substrate(s), digestion is inefficient. Yellow-rumped warblers, habituated to a sugary fruit-based diet, were transferred to a high fat seed diet. (A) Efficiency of [14C]glycerol trioleate absorption. (B) Mean retention time of digesta measured with [3H]glycerol triether, a nondigestible lipid marker. Within each figure, points that share the same lower case letters do not differ significantly in mean value [Fig. 1, with permission, from reference (243)].
Figure 5
Figure 5
Within the New World bat family Phyllostomidae, the evolutionary shift from insectivory to nectarivory or frugivory was accompanied by changes in digestive enzyme activity. An increase in sucrase (A; top right figure) and maltase (B; second from top) activity (which digest plant sugars in the diet), a decrease in trehalase (C; third from top) activity (digests insect sugar trehalose in the diet), and no change in aminopeptidase (D; bottom right) activity (because bats in all diet groups digest protein). In these plots, increasing animal matter in the bats’ natural diet is indicated by increasing δ15N in the bats’ tissue, and points are species means. The evidence that these correlations represent evolutionary transitions is based on the bats’ diets mapped onto their hypothesized phylogeny, shown on the left. The genera marked with asterisk were included in the data set. Two of the bat genera (Mormoops and Pteronotus) are in a sister family, Mormoopidae. Adapted from reference (248) (Fig. 4.24), with permission; redrawn, with permission, from reference (392).
Figure 6
Figure 6
Variation in bacterial communities of mammals with diet, analyzed by principal components analysis. The analysis was conducted on 106 individuals of 60 species from 13 orders of mammals. The three herbivores circled are individuals of red and giant panda, which are members of the order Carnivora. [Data from reference (290)].
Figure 7
Figure 7
Composition of bacterial species at different life stages of Drosophila melanogaster. “F” represents females and “M” represents males. [Data from reference (475)].
Figure 8
Figure 8
Fermentative degradation of complex carbohydrates by consortia of bacteria in the human colon. (A) Functional groups of bacteria (SRBs, sulfate-reducing bacteria). (B) Major bacterial taxa responsible for degradation of starch and fructan-carbohydrates. [Redrawn from reference (156)], with permission.
Figure 9
Figure 9
Transport of glucose and fructose across the mammalian enterocyte by SGLT1, GLUT2, and GLUT5. The insertion of GLUT2 into the apical membrane is mediated by the detection of luminal glucose by the TIR2/3 receptors and Ca2+ signaling, as described in text.
Figure 10
Figure 10
Peptide absorption. Uptake of di- and tripeptides across the apical membrane of enterocytes is mediated by PEPT1/H+ symport, with the H+ transport coupled to the Na+/H+ antiporter NHE3. The peptides are hydrolyzed by multiple cytosolic hydrolases, and the resultant amino acids are exported via the basolateral membrane by multiple transporters (see Table 3). The efflux of unhydrolyzed peptides across the basolateral membrane is mediated by peptide transporters that have not been identified at molecular level.
Figure 11
Figure 11
Absorption of cholesterol in mammalian intestine. Cholesterol presented in micelles to the apical membranes of enterocytes is taken up by Niemann-Pick C1-like-1 (NPC1L1) transporter, and esterified by acyl-CoA:cholesterol acyltransferase (ACAT2), an enzyme in the endoplasmic reticulum membrane. These esterified products are incorporated into apolipoprotein (apo)B48-containing chylomicrons in a microsomal triglyceride transport protein-dependent manner. After further processing, the chylomicrons are released from the basolateral membrane by exocytosis. Nonesterified sterol is eliminated into the gut lumen via ATP-binding cassette (ABC) transporters ABCG5 and ABCG8.
Figure 12
Figure 12
Paracellular absorption of glucose in the American robin (Turdus migratorius) investigated by pharmacokinetic methodology, using D-glucose, L-glucose (the glucose stereoisomer that is not be transported across the intestinal membrane), and 3-O-methyl-d-glucose (3OMD-glucose, a nonmetabolizable but actively transported analogue of D-glucose). (A) The dose-corrected plasma concentration of [3H]L-glucose as a function of time since American robins were injected (unfilled symbols) or gavaged (filled symbols) with the probe solution containing L-glucose. The areas under the curves (AUCs) are used to calculate fractional absorption, f, which averaged 87 ± 3%. (B) Time course of absorption of [3H]L-glucose, and [14C]D-glucose and 3OMD-glucose. Over early time points, the amounts of L-glucose absorbed was 50% to 70% of the amounts of D-glucose absorbed, which was interpreted to mean that the majority of glucose was absorbed by the paracellular pathway. Adapted from Figures 1 and 2 from reference (316), with permission.
Figure 13
Figure 13
(A) Fractional absorption of water soluble carbohydrates by intact birds (triangles, solid line) and nonflying eutherian mammals (circles, dashed line). Arabinose, rhamnose, cellobiose, and lactulose are inert, nonactively transported compounds whereas 3-O-methyl-d-glucose is not metabolized but is transported actively as well as passively absorbed. Fractional absorption of the passively absorbed probes declined with increasing molecule size and differed significantly between the two taxa, although the difference diminished with increasing molecule size. In contrast, absorption of 3-Omethyl-d-glucose did not differ significantly between the taxa. The interpretation is that species in both groups absorb most glucose, but that birds relied more on the passive, paracellular route. Figure 4A adapted, with permission, from reference (243). (B) Small intestine nominal (smoothbore tube) surface area in omnivorous birds and mammals (same symbols and lines as in A). There was no significant difference in slope between birds and nonflying mammals (n = 46 species and 41 species in birds and mammals, respectively). When the lines were fit to the common slope of 0.73, the calculated proportionality coefficients (intercept at unity) were significantly lower for birds than for mammals. Hence, small intestine nominal surface area in birds is 36% lower than that in nonflying mammals. Figure 4B adapted from reference (75).
Figure 14
Figure 14
The activity of α-chymotrypsin and α-amylase in the gastrointestinal tract of the locust L. migratoria fed on diets of different composition: PC (21% protein:21% carbohydrate), pc (10.5% protein: 10.5% carbohydrate), Pc (35% protein: 7% carbohydrate), and pC (7% protein: 35% carbohydrate). The enzyme activities were downregulated in insects on diets containing an excess of the substrate. [Data from Fig. 1 C and D of Clissold et al. (93).]
Figure 15
Figure 15
The effect of dietary soluble carbohydrate on the transcript abundance of the glucose transporter gene SGLT1 in (A) the mid-intestine of 28-day-old piglets and (B) the duodenum of horses fed sequentially on different diets including hay (essentially starch-free) and grain (containing 0.3% starch). [Data from Fig. 1A of reference (330) and Fig. 3A of reference (133).]
Figure 16
Figure 16
Diet-induced changes in the activity of digestive enzymes in 12-day-old nestling house sparrows (2–3 days before fledging). The birds were hand-fed on either 0-starch diet (mimicking insect food), comprising 20% corn oil and 59.63% casein; or +starch containing 25.4% corn starch, 8% corn oil, and 46.23% casein designed to mimic a mixture of insects and plant (seed) material. (A) Maltase activity. (B) Amino-peptidase N activity [Data from Fig. 5 of reference (43).]
Figure 17
Figure 17
Ontogenetic changes related to carbohydrate digestion and absorption in chicks. (A) Changes related to glucose absorption: activity was measured in jejunal homogenates prehatch (446), and posthatch in everted jejunal sleeves (348) [see also measures in vesicles (452)]. SGLT1 mRNA from references (405, 446). (B) Changes related to carbohydrate breakdown: sucrase isomaltase activity was measured in jejunal homogenates prehatch (446) and post hatch (445). SI mRNA from reference (405). (C) Changes related to homeobox gene of the caudal family (cdxA): protein and mRNA from reference (405).
Figure 18
Figure 18
Expression of serine protease Slctlp2 in common cutworm larvae (S. litura; Lepidoptera). (A) mRNA from midguts of sixth instar larvae at days 0 to 7. Day 0 is the day the larvae just molted. At days 6 and 7 of the sixth larval stadium, the larvae stopped feeding and entered the prepupal stage. Data are transcript abundance normalized to actin transcript. Each bar represents the mean of three independent repeats of the experiment. (B) Induced expression of Slctlp2 mRNA by starvation and refeeding in sixth instar larvae. “F” represents larvae that just molted into the sixth instar and fed for 6, 24, 48, and 72 h post sixth instar molt. “S” represents those starved for 6, 24, 48, and 72 h. “RF” represents larvae starved for half the time period indicated and then fed the latter half of the time period indicated. Each bar represents the mean of three independent repeats of the experiment. Bars (i.e., means) within a discrete time period (i.e., at 6, 24, 48, or 72 h) that share a common letter did not differ significantly, whereas different letters indicate significant differences at P < 0.05. Both figures based on data from reference (488).

References

    1. Abe T, Higashi M. Cellulose centered perspective on community structure. Oikos. 1991;60:127–133.
    1. Acamovic T, Brooker JD. Biochemistry of plant secondary metabolites and their effects in animals. Proc Nutr Soc. 2005;64:403–412. - PubMed
    1. Adeola O, King DE. Developmental changes in morphometry of the small intestine and jejunal sucrase activity during the first nine weeks of postnatal growth in pigs. J Anim Sci. 2006;84:112–118. - PubMed
    1. Afik D, Karasov WH. The trade-offs between digestion rate and efficiency in warblers and their ecological implications. Ecology. 1995;76:2247–2257.
    1. Allardyce BJ, Linton SM, Saborowski R. The last piece in the cellulase puzzle: The characterisation of beta-glucosidase from the herbivorous gecarcinid land crab Gecarcoidea natalis . J Exp Biol. 2010;213:2950–2957. - PubMed

Publication types

LinkOut - more resources