. 2013 May 29;10(85):20130326.
doi: 10.1098/rsif.2013.0326. Print 2013 Aug 6.

Impact of plant shoot architecture on leaf cooling: a coupled heat and mass transfer model

Affiliations

Impact of plant shoot architecture on leaf cooling: a coupled heat and mass transfer model

L J Bridge et al. J R Soc Interface. .

Abstract

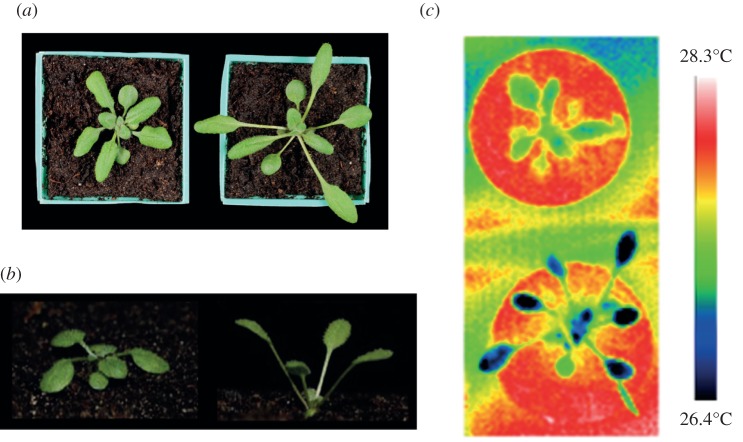
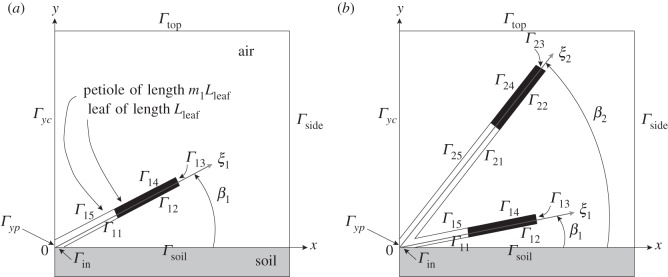
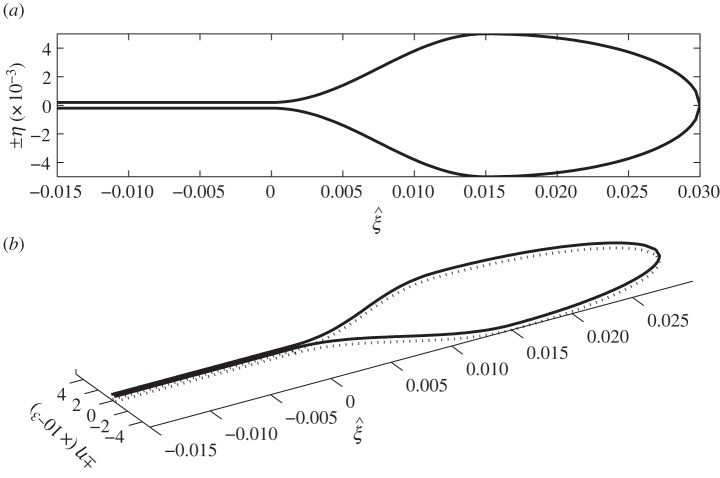
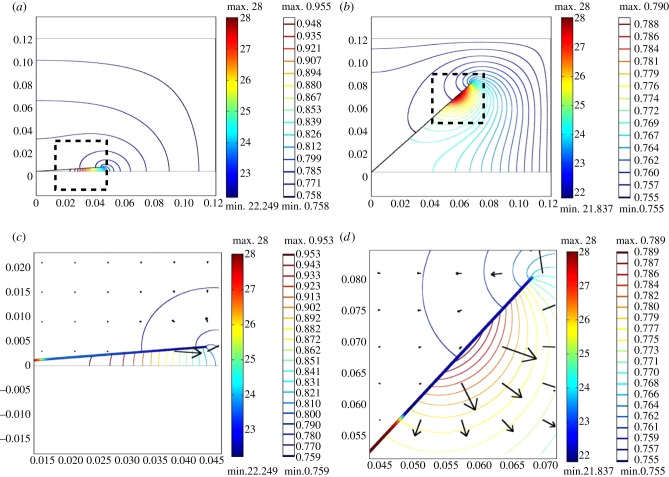
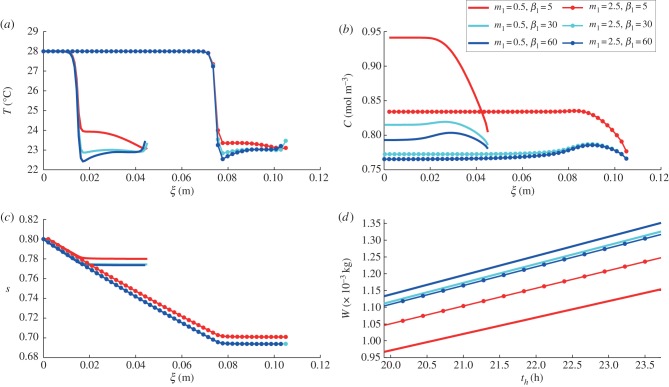
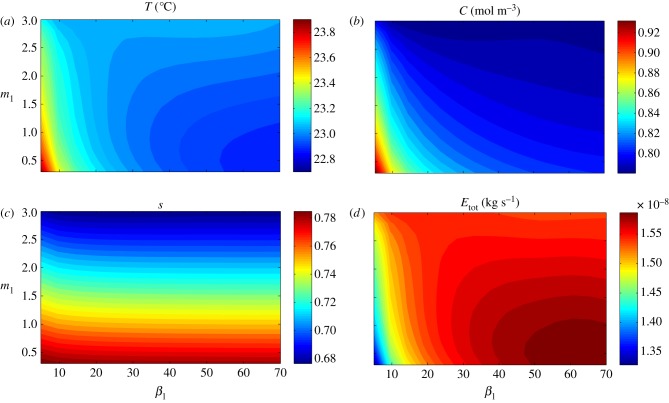
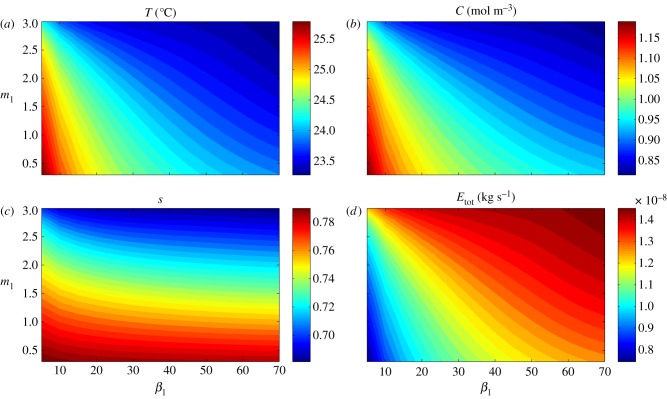
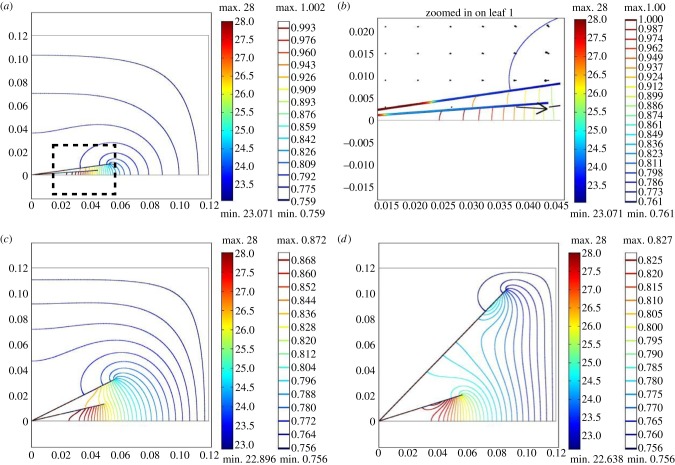
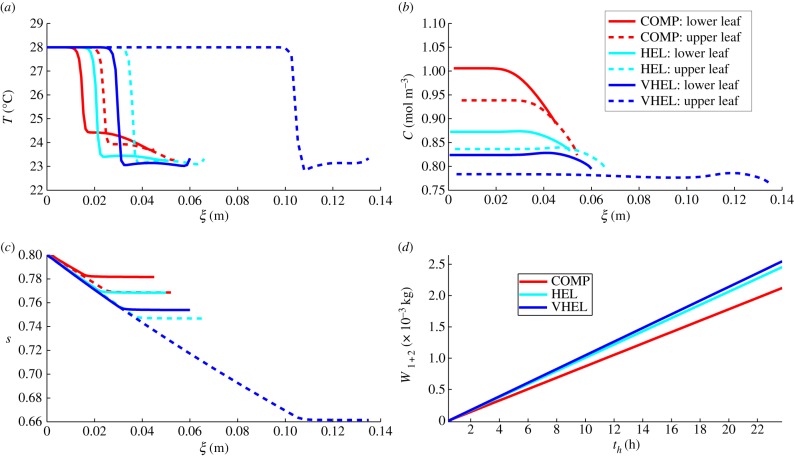
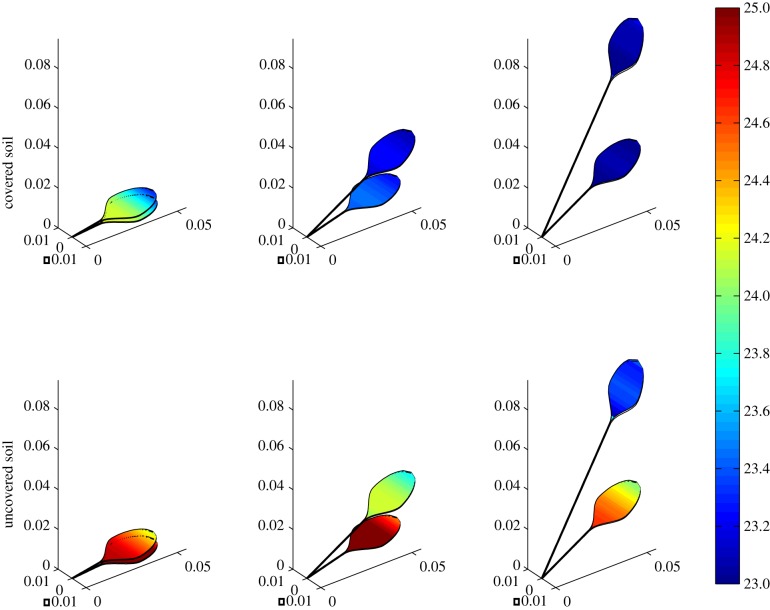
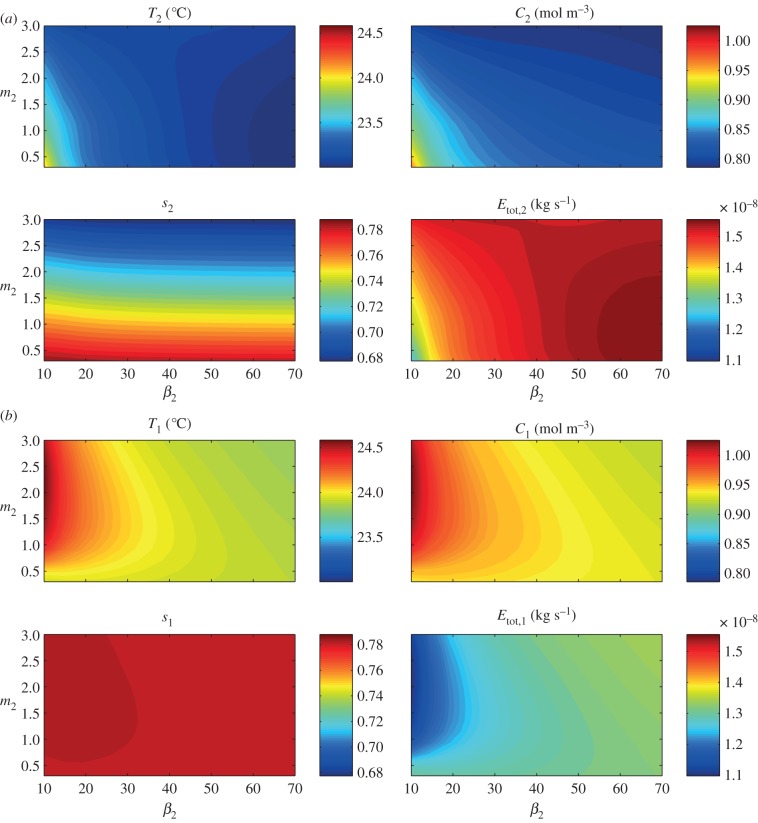
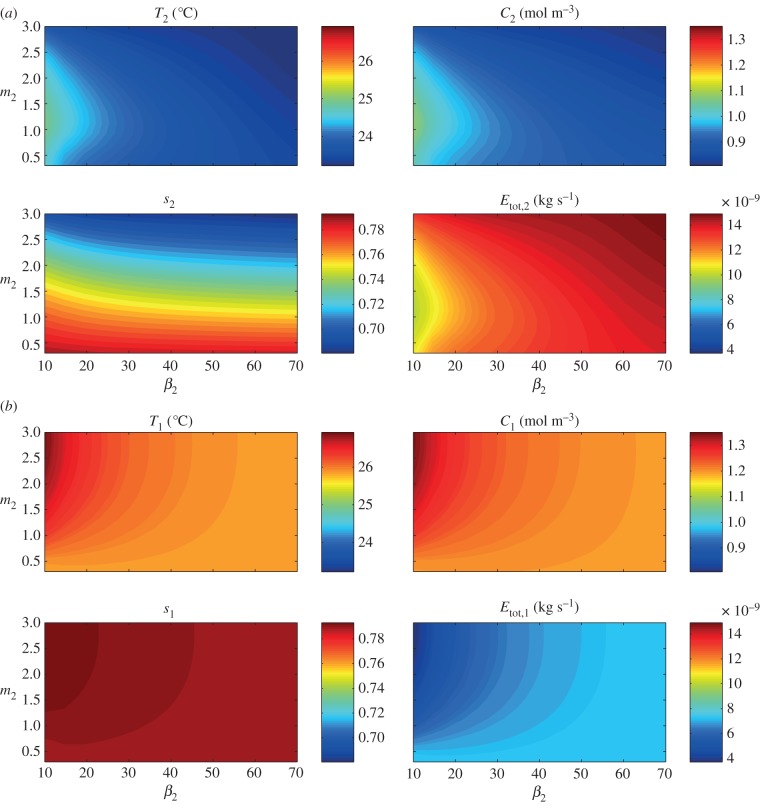
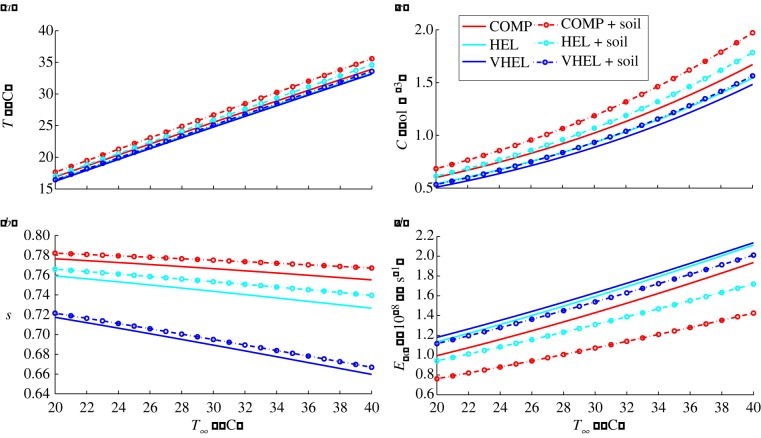
Plants display a range of striking architectural adaptations when grown at elevated temperatures. In the model plant Arabidopsis thaliana, these include elongation of petioles, and increased petiole and leaf angles from the soil surface. The potential physiological significance of these architectural changes remains speculative. We address this issue computationally by formulating a mathematical model and performing numerical simulations, testing the hypothesis that elongated and elevated plant configurations may reflect a leaf-cooling strategy. This sets in place a new basic model of plant water use and interaction with the surrounding air, which couples heat and mass transfer within a plant to water vapour diffusion in the air, using a transpiration term that depends on saturation, temperature and vapour concentration. A two-dimensional, multi-petiole shoot geometry is considered, with added leaf-blade shape detail. Our simulations show that increased petiole length and angle generally result in enhanced transpiration rates and reduced leaf temperatures in well-watered conditions. Furthermore, our computations also reveal plant configurations for which elongation may result in decreased transpiration rate owing to decreased leaf liquid saturation. We offer further qualitative and quantitative insights into the role of architectural parameters as key determinants of leaf-cooling capacity.

Keywords: computational partial differential equations; leaf hyponasty; mathematical modelling; petiole elongation; plant architecture; transpiration.


Figures

Figure 1.
Figure 1.
Observed architectural features of Arabidopsis thaliana shoots grown at different temperatures. (a) Aerial photographs of plants pre-grown for 2 weeks in continuous irradiation at 22°C before transfer to 22°C (left) or 28°C (right) for a further 2 weeks. (b) Side profile of Arabidopsis shoots pre-grown on soil for 2 weeks at 22°C before transfer to 22°C (left) or 28°C (right) for a further week, showing elongated and elevated petioles at higher growth temperature. Figure adapted from Koini et al. [1], with permission from Elsevier. (c) Thermal images of plants grown at 22°C (top) and 28°C (bottom), when placed in a 28°C environment. Blue corresponds to lowest temperature, whereas red corresponds to highest. Leaves in elongated plant are approximately 1°C cooler than compact plant. Figure adapted from Crawford et al. [2], with permission from Elsevier.
Figure 2.
Figure 2.
Schematic diagram of model geometry, illustrating the computational domain with boundary portions: (a) single leaf and petiole, emanating from the origin, (b) two leaves and petioles.
Figure 3.
Figure 3.
(a) Proposed leaf geometry, taking Lleaf = 0.03 m, r = 0.0004 m and ηmax = 0.02 m. In (b), the dotted line represents the lower leaf surface.
Figure 4.
Figure 4.
Single leaf, varying architecture: temperature within leaf (°C; filled heat map, left-hand scale bar) and water vapour concentration (mol m–3; colour contours, right-hand scale bar) in surrounding air, with saturation s variable throughout the petiole and leaf. Arrows indicate water vapour flux. Axis scales are in metres. (a) Compact plant with m1 = 0.5, β1 = 5°. (b) Very hyponastic elongated plant with m1 = 2.5, β1 = 50°. (c) Detail of (a). (d) Detail of (b).
Figure 5.
Figure 5.
Single leaf, varying architecture: (a) temperature T, (b) water vapour concentration C and (c) liquid saturation s profiles (as functions of leaf/petiole axial coordinate ξ) at steady state for a single leaf after introduction to 28°C environment, (d) with total water loss W time courses. Elongation and elevation are controlled by varying m1 and β1. Leaf length = 0.03 m, so for m1 = 0.5, the leaf–petiole junction is at ξ = 0.15, whereas for m1 = 2.5, the leaf–petiole junction is at ξ = 0.75.
Figure 6.
Figure 6.
Single leaf, covered soil: the effect of architectural parameters β1 (petiole angle in degrees) and m1 (petiole to leaf length ratio) on leaf (a) temperature T, (b) water vapour concentration C, (c) saturation s and (d) total transpiration rate Etot, at steady state (time th = 24 h), after introduction to T = 28°C environment.
Figure 7.
Figure 7.
Single leaf, uncovered soil: the effect of architectural parameters β1 (petiole angle in degrees) and m1 (petiole to leaf length ratio) on leaf (a) temperature T, (b) water vapour concentration C, (c) saturation s and (d) total transpiration rate Etot, at steady state (time th = 24 h), after introduction to T = 28°C environment. Here, we mimic the natural environment by ‘uncovering’ the soil to allow a water vapour flux from the soil surface.
Figure 8.
Figure 8.
Two leaves, varying architecture: temperature within two leaves (°C; filled heat maps, left-hand scale bar) and water vapour concentration (mol m–3) in surrounding air (colour contours, right-hand scale bar). Axis scales are in metres. (a) Compact (COMP) plant. (b) Detail of compact (COMP) plant, lower leaf. Arrows indicate water vapour flux. (c) Hyponastic elongated (HEL) plant. (d) Very hyponastic elongated (VHEL) plant.
Figure 9.
Figure 9.
Two leaves, varying architecture: graphs of (a) temperature T, (b) water vapour concentration C and (c) liquid saturation s profiles (as functions of leaf axial coordinates ξ1,2) at steady state for two-leaf plants in a 28°C environment, (d) with total water loss W1+2 (from both leaves) time courses. Plant architectures: compact (red), hyponastic elongated (cyan) and very hyponastic elongated (blue); upper leaf dashed lines.
Figure 10.
Figure 10.
Two leaves, covered versus uncovered soil: temperature (°C) heat maps imposed on leaf geometry, showing temperature distribution through leaves and petioles in three two-leaf plants. In the top row, there is no water vapour flux normal to the plane y = 0, as in the covered-soil experiments in Crawford et al. [2], whereas the bottom row simulates an uncovered soil. Axis scales are in metres.
Figure 11.
Figure 11.
Two leaves, covered soil: effect of architectural parameters β2 (upper leaf petiole angle in degrees) and m2 (upper petiole to leaf length ratio; with fixed β1 = 5° and m1 = 0.5) on leaf temperature T1,2, water vapour concentration C1,2, saturation s1,2 and total transpiration rate Etot,1,2 at steady state, after introduction to 28°C environment. (a) Upper leaf (leaf 2). (b) Lower leaf (leaf 1).
Figure 12.
Figure 12.
Two leaves, uncovered soil: effect of architectural parameters β2 (upper leaf petiole angle in degrees) and m2 (upper petiole to leaf length ratio; with fixed β1 = 5° and m1 = 0.5) on leaf temperature T1,2, water vapour concentration C1,2, saturation s1,2, and total transpiration rate Etot,1,2 at steady state, after introduction to 28°C environment. (a) Upper leaf (leaf 2). (b) Lower leaf (leaf 1).
Figure 13.
Figure 13.
Two leaves, varying ambient temperature: effect on leaf (a) temperature T, (b) saturation s, (c) water vapour concentration C and (d) total transpiration rate Etot at steady state, after introduction to T = T environment. Simulations shown for compact (COMP), hyponastic elongated (HEL) and very hyponastic elongated (VHEL) plants. Values shown are for centre of upper leaf, both with (dotted line with circles) and without (solid line) vapour flux from the soil surface.
Figure 14.
Figure 14.
One leaf, varying petiole inlet saturation: temperature T1 at steady state in response to varying water supply at petiole vertex/inlet. With fixed s0, increasing m1 gives increased T1. However, increasing m1 (and also s0) along the curve in black gives reduced T1.

References

    1. Koini MA, Alvey L, Allen T, Tilley CA, Harberd NP, Whitelam GC, Franklin KA. 2009. High temperature-mediated adaptations in plant architecture require the bHLH transcription factor PIF4. Curr. Biol. 19, 408–41310.1016/j.cub.2009.01.046 (doi:10.1016/j.cub.2009.01.046) - DOI - DOI - PubMed
    1. Crawford AJ, McLachlan DH, Hetherington AM, Franklin KA. 2012. High temperature exposure increases plant cooling capacity. Curr. Biol. 22, R396–R39710.1016/j.cub.2012.03.044 (doi:10.1016/j.cub.2012.03.044) - DOI - DOI - PubMed
    1. Gray WM, Östin A, Sandberg G, Romano CP, Estelle M. 1998. High temperature promotes auxin-mediated hypocotyl elongation in Arabidopsis. Proc. Natl Acad. Sci. USA 95, 7197–720210.1073/pnas.95.12.7197 (doi:10.1073/pnas.95.12.7197) - DOI - DOI - PMC - PubMed
    1. Stavang JA, Gallego-Bartolome J, Gomez M, Yoshida S, Asami T, Olsen JE, Garca-Martnez JL, Alabadi D, Blazquez MA. 2009. Hormonal regulation of temperature-induced growth in Arabidopsis. Plant J. 60, 589–60110.1111/j.1365-313X.2009.03983.x (doi:10.1111/j.1365-313X.2009.03983.x) - DOI - DOI - PubMed
    1. Franklin KA, et al. 2011. Phytochrome interacting factor 4 regulates auxin biosynthesis at high temperature. Proc. Natl Acad. Sci. USA 108, 20 231–20 23510.1073/pnas.1110682108 (doi:10.1073/pnas.1110682108) - DOI - DOI - PMC - PubMed

Publication types

MeSH terms

LinkOut - more resources