. 2013 May 16:7:207.
doi: 10.3389/fnhum.2013.00207. eCollection 2013.

BOLD Frequency Power Indexes Working Memory Performance

Affiliations

BOLD Frequency Power Indexes Working Memory Performance

Joshua Henk Balsters et al. Front Hum Neurosci. .

Abstract

Electrophysiology studies routinely investigate the relationship between neural oscillations and task performance. However, the sluggish nature of the BOLD response means that few researchers have investigated the spectral properties of the BOLD signal in a similar manner. For the first time we have applied group ICA to fMRI data collected during a standard working memory task (delayed match-to-sample) and using a multivariate analysis, we investigate the relationship between working memory performance (accuracy and reaction time) and BOLD spectral power within functional networks. Our results indicate that BOLD spectral power within specific networks (visual, temporal-parietal, posterior default-mode network, salience network, basal ganglia) correlated with task accuracy. Multivariate analyses show that the relationship between task accuracy and BOLD spectral power is stronger than the relationship between BOLD spectral power and other variables (age, gender, head movement, and neuropsychological measures). A traditional General Linear Model (GLM) analysis found no significant group differences, or regions that covaried in signal intensity with task accuracy, suggesting that BOLD spectral power holds unique information that is lost in a standard GLM approach. We suggest that the combination of ICA and BOLD spectral power is a useful novel index of cognitive performance that may be more sensitive to brain-behavior relationships than traditional approaches.

Keywords: BOLD oscillations; ICA; aging; delayed match-to-sample; fMRI.


Figures

Figure 1
Figure 1
Delay match-to-sample trial structure. A fixation cross was presented in the center of the screen for the duration of the study. Sample cues (either a face or a line) were presented in the center of the screen during the first 2TRs of a trial (stimulus onset jittered 0–3250 ms from the onset of the first TR), after a variable time delay (4299–9630 ms), a probe cue was presented left or right of the fixation cross (stimulus onset jittered 0–2500 ms from the onset of the fifth TR). Participants responded as quickly possible at the presentation of the probe cue making either a left/right judgment or a match/non-match judgment. Face and line probe cues were presented in a different orientation to the sample cue.
Figure 2
Figure 2
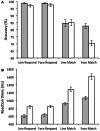
Behavioral Results. Bar graphs showing task accuracy (A) and response times. (B) Gray bars show average scores for young participants; white bars show average scores for elderly participants. Error bars show the standard error.
Figure 3
Figure 3
Multivariate statistics. Results from the reduced mancova models, depicting the significance of covariates of interest and nuisance predictors for power spectra in log10(p) units. Gray cells indicate terms that were removed from the full model during backward selection process.
Figure 4
Figure 4
Components showing a relationship between spectral power and face match accuracy. Left column shows components where spectral power significantly covaried with task accuracy. Red markers indicate a positive relationship with task accuracy (greater spectral power with higher accuracy), blue markers indicate a negative relationship (greater spectral power with lower accuracy), black indicates their was no significant difference after correcting for multiple comparisons. Right column shows spatial maps for components which showed a significant relationship with face match accuracy. All results are FDR thresholded (p < 0.05).
Figure 5
Figure 5
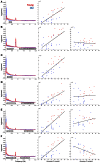
Group spectral profiles and correlations with face match accuracy. Left column shows spectral power distributions for young and old participants. Shaded error bars show the standard error. Black markers underneath highlight where spectral power covaried with task accuracy (these are the same values shown in Figure 4). Middle and right columns show correlations with spectral power and accuracy after age was regressed out of the data. Middle column shows correlations for significant frequency points at lower frequencies (<0.1 Hz). The right column shows correlations for significant frequency points >0.1 Hz. (A) Putamen (IC 14), (B) Visual cortex (IC 15), (C) right STG (IC 26), (D) precuneus (posterior DMN; IC 48), (E) left insula (IC 63), (F) cingulo-insula network (salience network; IC 65). In all plots red refers to young participants and blue to elderly.
Figure 6
Figure 6
Components showing a relationship between spectral power and face match reaction time (RT). (A) Components where spectral power significantly covaried with face match RT. Red markers indicate a positive relationship (greater spectral power = slower RT), black indicates their was no significant difference after correcting for multiple comparisons. (B) Significant covariation with voxel intensity and face match RT within left cerebellar lobule HVI. (C) IC 46 spatial map. (D) IC 62 spatial map. All results are FDR thresholded (p < 0.05).
Figure 7
Figure 7
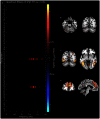
Overlap between IC 65 (salience newtork) and SPM results. Red voxels show the spatial map for IC 65 which was identified to track task accuracy at both low (<0.1 Hz) and high (>0.1 Hz) frequencies. Activations in yellow were from the SPM analysis showing common activations between both groups for match compared to respond blocks. Both sets of activations were FDR corrected (p < 0.05).

References

    1. Aguirre G. K., Zarahn E., D’Esposito M. (1998). The variability of human, BOLD hemodynamic responses. Neuroimage 8, 360–36910.1006/nimg.1998.0367 - DOI - PubMed
    1. Allen E. A., Damaraju E., Plis S. M., Erhardt E. B., Eichele T., Calhoun V. D. (2012). Tracking whole-brain connectivity dynamics in the resting state. Cereb. Cortex. 10.1093/cercor/bhs352 - DOI - PMC - PubMed
    1. Allen E. A., Erhardt E. B., Damaraju E., Gruner W., Segall J. M., Silva R. F., et al. (2011). A baseline for the multivariate comparison of resting-state networks. Front. Syst. Neurosci. 5:2.10.3389/fnsys.2011.00002 - DOI - PMC - PubMed
    1. Andersson J. L., Hutton C., Ashburner J., Turner R., Friston K. (2001). Modeling geometric deformations in EPI time series. Neuroimage 13, 903–91910.1006/nimg.2001.0763 - DOI - PubMed
    1. Andrews-Hanna J. R., Snyder A. Z., Vincent J. L., Lustig C., Head D., Raichle M. E., et al. (2007). Disruption of large-scale brain systems in advanced aging. Neuron 56, 924–93510.1016/j.neuron.2007.10.038 - DOI - PMC - PubMed

LinkOut - more resources