. 2013 Jul 12;288(28):20488-98.
doi: 10.1074/jbc.M112.447250. Epub 2013 May 29.

Epidermal growth factor receptor (EGFR) signaling promotes proliferation and survival in osteoprogenitors by increasing early growth response 2 (EGR2) expression

Affiliations

Epidermal growth factor receptor (EGFR) signaling promotes proliferation and survival in osteoprogenitors by increasing early growth response 2 (EGR2) expression

Abhishek Chandra et al. J Biol Chem. .

Abstract

Maintaining bone architecture requires continuous generation of osteoblasts from osteoprogenitor pools. Our previous study of mice with epidermal growth factor receptor (EGFR) specifically inactivated in osteoblast lineage cells revealed that EGFR stimulates bone formation by expanding the population of mesenchymal progenitors. EGFR ligands are potent regulators for the osteoprogenitor pool, but the underlying mechanisms are largely unknown. Here we demonstrate that activation of EGFR increases the number of osteoprogenitors by promoting cell proliferation and suppressing either serum depletion-induced or TNFα-induced apoptosis mainly through the MAPK/ERK pathway. Mouse calvarial organ culture revealed that EGF elevated the number of proliferative cells and decreased the number of apoptotic cells, which led to increased osteoblasts. Microarray analysis of MC3T3 cells, an osteoprogenitor cell line, revealed that EGFR signaling stimulates the expression of MCL1, an antiapoptotic protein, and a family of EGR transcription factors (EGR1, -2, and -3). The up-regulation of MCL1 and EGR2 by EGF was further confirmed in osteoprogenitors close to the calvarial bone surface. Overexpression of NAB2, a co-repressor for EGRs, attenuated the EGF-induced increase in osteoprogenitor number. Interestingly, knocking down the expression of EGR2, but not EGR1 or -3, resulted in a similar effect. Using inhibitor, adenovirus overexpression, and siRNA approaches, we demonstrate that EGFR signaling activates the MAPK/ERK pathway to stimulate the expression of EGR2, which in turn leads to cell growth and MCL1-mediated cell survival. Taken together, our data clearly demonstrate that EGFR-induced EGR2 expression is critical for osteoprogenitor maintenance and new bone formation.

Keywords: Apoptosis; Bone; EGR2; Epidermal Growth Factor Receptor (EGFR); Osteoporosis; Osteoprogenitors; Proliferation.


Figures
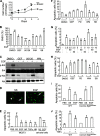
FIGURE 1.
FIGURE 1.
EGFR signaling promotes proliferation and survival in osteoprogenitor cells. A, cell counts were performed at the indicated days with MC3T3 cells cultured in αMEM with 2% FBS in the presence or absence of 50 ng/ml EGF. **, p < 0.01; ***, p < 0.001 versus control (con). B, BrdU incorporation assay indicates that EGF stimulates osteoprogenitor proliferation through MAPK/ERK and PI3K pathways. MC3T3 cells were serum-starved for 1 day and pretreated with the following for 1 h: DMSO (0.1% v/v), 5 μm gefitinib (GEF), 20 μm U0126, 1.5 μm wortmannin (WM), and 10 μm SB202190 (SB). Cells were then treated with either vehicle or EGF overnight before the addition of BrdU for the last 4 h. *, p < 0.05; **, p < 0.01; ***, p < 0.001 versus DMSO without EGF; #, p < 0.01 versus SB202190 without EGF. C, activation of EGFR signaling stimulates the phosphorylation of ERK and AKT in osteoprogenitors. MC3T3 cells were pretreated with either DMSO or inhibitors followed by 1 h of EGF treatment. Cells were then harvested and subjected to Western blot analyses of phospho-ERK (p-Erk) and phospho-AKT (p-Akt). D, representative images of EB/AO staining. MC3T3 cells were serum-starved overnight followed by the addition of control (SS) or EGF for 1 day. An arrow and an arrowhead point to an early (green) apoptotic cell and late (red) apoptotic cells with condensed chromatin, respectively, whereas live cells exhibit normal nuclear green fluorescence. E, EGF-like ligands, including EGF, amphiregulin (AR), TGFα, and HB-EGF (HB), are potent inhibitors for the apoptosis of osteoprogenitors (MC3T3 cells and rat primary calvarial osteoprogenitors) induced by serum depletion. Cells cultured in medium with 10% FBS were used as a control. *, p < 0.05; **, p < 0.01; ***, p < 0.001 versus (SS); #, p < 0.01 versus FBS. F, EGFR signaling suppresses osteoprogenitor apoptosis induced by serum depletion mainly through the MAPK/ERK pathway. MC3T3 cells were serum-starved for 1 day and pretreated with inhibitors for 1 h followed by either vehicle or EGF for 1 day before EB/AO staining. *, p < 0.05; **, p < 0.01 versus DMSO without EGF; #, p < 0.01; &, p < 0.001 versus their respective control. PD, PD98059 (a MEK1 inhibitor). G, EGFR signaling attenuates the TNFα-induced apoptosis in osteoprogenitors. MC3T3 cells were cultured in medium containing 2% FBS and treated with 50 ng/ml EGF or TGFα for 30 min followed by the addition of various amounts of TNFα (ng/ml). One day later, cells were stained for apoptosis assay. #, p < 0.01 versus no treatment control; *, p < 0.05; **, p < 0.01 versus their respective TNFα control. H, EGFR signaling attenuates the TNFα-induced apoptosis mainly through the MAPK/ERK pathway. #, p < 0.01 versus their respective control. I and J, mesenchymal progenitors from Col-Cre EgfrWa5/flox mice did not respond to the EGF survival signal under either serum depletion (I) or TNFα-induced (J) conditions. WT, wild type. *, p < 0.05; **, p < 0.01 versus FBS or no treatment control; $, p < 0.05; #, p < 0.01 versus SS or TNFα control.
FIGURE 2.
FIGURE 2.
Activation of EGFR signaling increases osteoblast number and stimulates proliferation and survival in osteoprogenitors close to the calvarial bone surface. A–D, histological examination of WT calvariae cultured in DMEM with 10% FBS (FBS), DMEM only (SS), or DMEM containing 50 ng/ml EGF (EGF) using H&E (A), Ki67 (B), TUNEL (C), and tartrate-resistant acid phosphatase (TRAP) (D) staining for quantifying osteoblasts (Ob), proliferative (Ki67+) cells, apoptotic (TUNEL+) cells, and osteoclasts (Oc). BS, bone surface. Arrows point to positive cells. E, quantification of osteoclasts in calvariae from WT and Col-Cre EgfrWa5/flox mice after being cultured in the presence or absence of EGF. **, p < 0.01; ***, p < 0.001 versus FBS; #, p < 0.01; &, p < 0.001 versus serum starvation (SS); $, p < 0.05 versus WT with EGF.
FIGURE 3.
FIGURE 3.
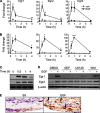
EGFR signaling stimulates MCL1 expression in osteoprogenitors. A and B, qRT-PCR (A) and Western blotting (B) show the time course of EGF up-regulation of MCL1 in MC3T3 cells. *, p < 0.05 versus control (con). C, various EGF-like ligands increase MCL1 expression. MC3T3 cells were serum-starved overnight followed by the addition of 10% FBS, vehicle (SS), or EGF-like ligands (50 ng/ml) for 1 h. Cell lysates were collected for Western blotting. AR, amphiregulin. D and E, the MAPK/ERK pathway, but not PI3K/AKT pathway, is the major mediator for EGF-induced MCL1 expression. MC3T3 cells (D) or rat primary calvarial osteoprogenitors (E) were pretreated with either DMSO or inhibitors followed by 1 h of EGF treatment. GEF, gefitinib; WM, wortmannin; C56, an EGFR-specific inhibitor; PD98059, a MEK1 inhibitor. F, immunohistochemistry of MCL1 (arrows) in mouse calvariae from WT and Col-Cre EgfrWa5/flox mice after being cultured in the presence or absence of EGF.
FIGURE 4.
FIGURE 4.
EGFR signaling promotes the expression of EGR1, -2, and -3 in osteoprogenitors. A and B, qRT-PCR shows the time courses of Egr1, -2, and -3 mRNAs in MC3T3 cells (A) and rat primary calvarial osteoprogenitors (B) after EGF treatment. *, p < 0.05; **, p < 0.01; ***, p < 0.001 versus control (con). C, Western blot assays reveal the increases in EGR1 and -2 protein levels in MC3T3 cells after EGF treatment. D, MAPK/ERK pathway, but not PI3K/AKT pathway, is the major mediator for EGF-induced expression of EGR1 and -2. MC3T3 cells were pretreated with either DMSO or inhibitors followed by 1 h of EGF treatment. GEF, gefitinib; WM, wortmannin. E, immunohistochemistry of EGR2 (arrows) in mouse calvariae after being cultured in the presence or absence of EGF. SS, serum starvation control.
FIGURE 5.
FIGURE 5.
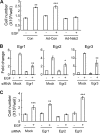
EGFR signaling maintains osteoprogenitor population via EGR2. A, overexpression of NAB2 abolishes the EGF-induced increase in osteoprogenitor number. MC3T3 cells were infected with medium (con), control virus (Ad-Con), or NAB2-expressing virus (Ad-Nab2) followed by EGF treatment for 5 days in medium with 2% FBS, and cell numbers per well were counted. **, p < 0.01; ***, p < 0.001 versus their respective control. B, siRNAs for EGR1, -2, and -3 block the EGF-induced mRNA expression of their corresponding EGRs. MC3T3 cells were transfected with either mock or EGR siRNAs. Two days later, the mRNA level of individual Egr genes was measured by qRT-PCR after 1 h of EGF treatment. *, p < 0.05; **, p < 0.01 versus mock with EGF. C, knockdown of EGR2, but not EGR1 or -3, attenuates the EGF-induced increase in osteoprogenitor number. MC3T3 cells were transfected with either mock or EGR siRNAs followed by EGF treatment for 5 days, and cell numbers per well were counted. **, p < 0.01; ***, p < 0.001 versus their respective control.
FIGURE 6.
FIGURE 6.
EGFR signaling stimulates osteoprogenitor proliferation via EGR2. A–C, BrdU incorporation assays show that EGF-induced osteoprogenitor proliferation was diminished by overexpression of NAB2 (Ad-Nab2) (A), siRNA knockdown of EGR2 (B), or overexpression of EGR2 by adenovirus (Ad-Egr2) (C). Ad-Con, control virus. *, p < 0.05; **, p < 0.01; ***, p < 0.001 versus Ad-Con without EGF.
FIGURE 7.
FIGURE 7.
EGR2 mediates the antiapoptotic effect of EGFR. A, overexpressing NAB2 abolishes the EGF-induced cell survival. MC3T3 cells were infected with control virus (Ad-Con) or NAB2-expressing virus (Ad-Nab2) followed by EGF treatment for 1 day in serum-free medium and stained with EB/AO for quantification of apoptotic cells. **, p < 0.01 versus Ad-Con without EGF. B, Western blots confirm the overexpression of NAB2 by Ad-Nab2 infection and demonstrate that NAB2 overexpression abolishes the EGF-induced increase of MCL1. C, siRNA knockdown of EGR2 expression attenuates the survival effect of EGFR on apoptotic osteoprogenitors induced by serum depletion or TNFα. *, p < 0.05; **, p < 0.01 versus mock control; ***, p < 0.001 versus control. D, down-regulation of EGR2 decreased the EGF-induced MCL1 expression. E, overexpression of EGR2 by adenovirus (Ad-Egr2) in MC3T3 cells decreases the basal level of apoptosis and attenuates the EGF-suppressed apoptosis. *, p < 0.05; **, p < 0.01 versus Ad-Con control. F, Western blots confirm the overexpression of EGR2 by Ad-Egr2 infection and demonstrate that that EGR2 increases the amount of MCL1.

References

    1. Parfitt A. M., Han Z. H., Palnitkar S., Rao D. S., Shih M. S., Nelson D. (1997) Effects of ethnicity and age or menopause on osteoblast function, bone mineralization, and osteoid accumulation in iliac bone. J. Bone Miner. Res. 12, 1864–1873 - PubMed
    1. Weinstein R. S., Jilka R. L., Parfitt A. M., Manolagas S. C. (1998) Inhibition of osteoblastogenesis and promotion of apoptosis of osteoblasts and osteocytes by glucocorticoids. Potential mechanisms of their deleterious effects on bone. J. Clin. Invest. 102, 274–282 - PMC - PubMed
    1. Bellantuono I., Aldahmash A., Kassem M. (2009) Aging of marrow stromal (skeletal) stem cells and their contribution to age-related bone loss. Biochim. Biophys. Acta 1792, 364–370 - PubMed
    1. Caplan A. I. (2009) Why are MSCs therapeutic? New data: new insight. J. Pathol. 217, 318–324 - PMC - PubMed
    1. Krampera M., Pasini A., Rigo A., Scupoli M. T., Tecchio C., Malpeli G., Scarpa A., Dazzi F., Pizzolo G., Vinante F. (2005) HB-EGF/HER-1 signaling in bone marrow mesenchymal stem cells: inducing cell expansion and reversibly preventing multilineage differentiation. Blood 106, 59–66 - PubMed

Publication types

MeSH terms

Substances