. 2013 Jul 1;191(1):472-9.
doi: 10.4049/jimmunol.1300521. Epub 2013 May 29.

Complete TCR-α gene locus control region activity in T cells derived in vitro from embryonic stem cells

Affiliations

Complete TCR-α gene locus control region activity in T cells derived in vitro from embryonic stem cells

Armin Lahiji et al. J Immunol. .

Abstract

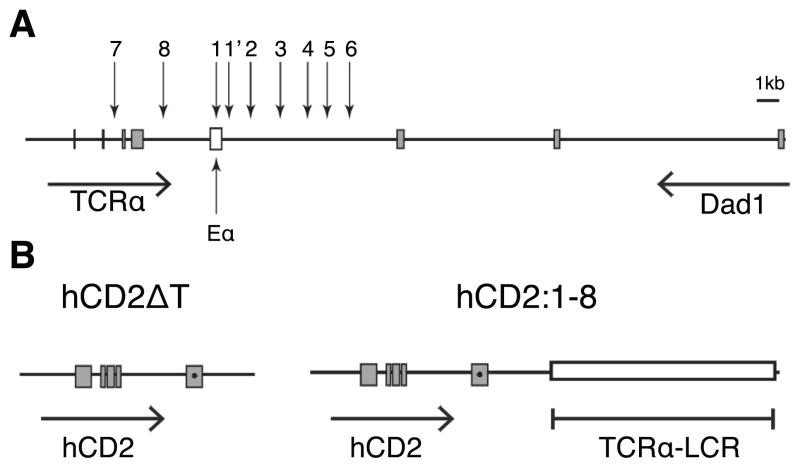
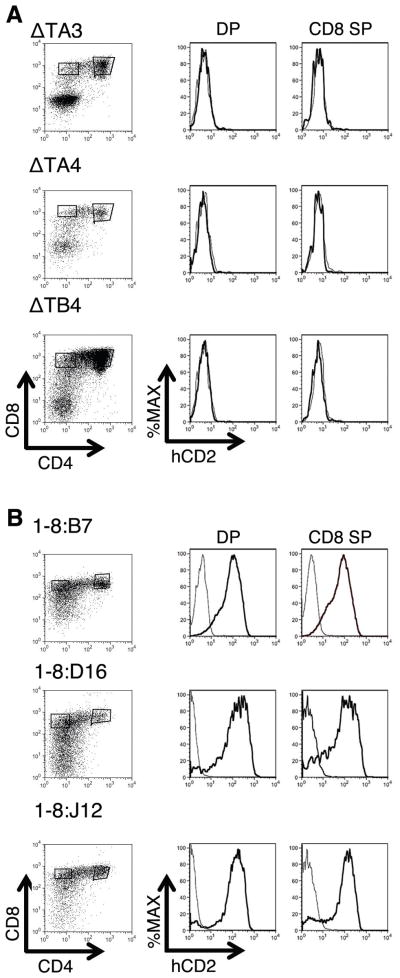
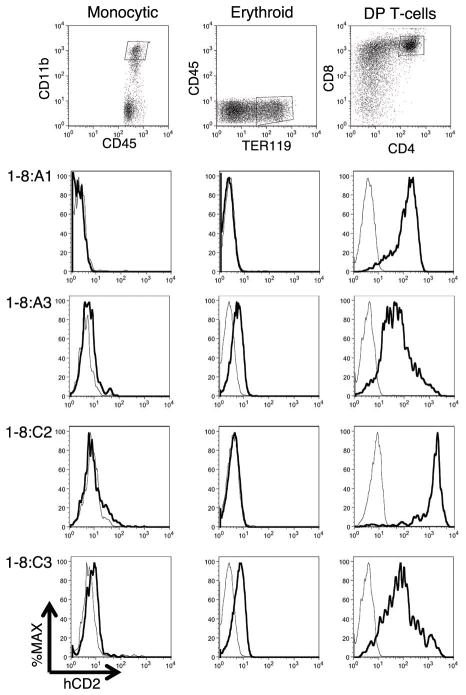
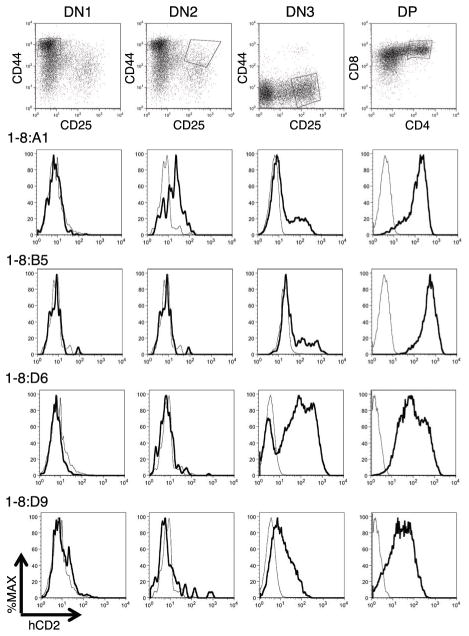
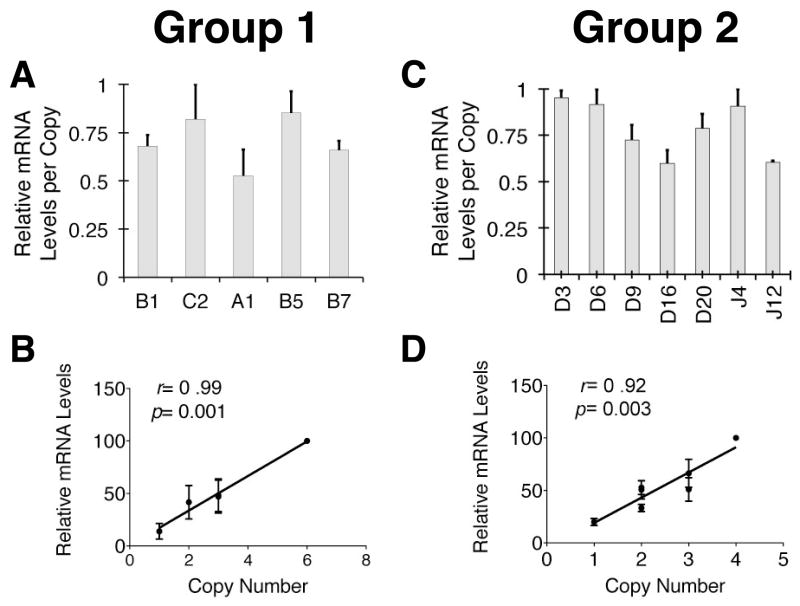
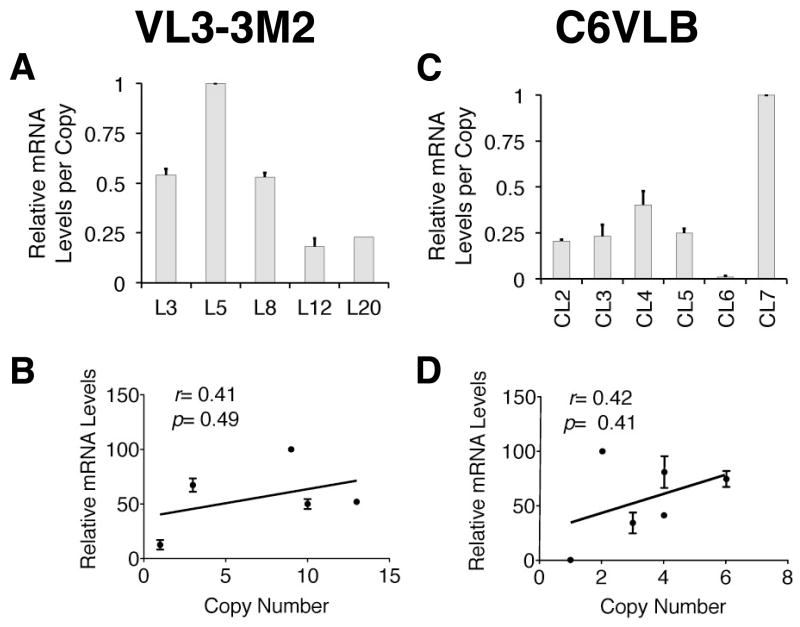
Locus control regions (LCRs) are cis-acting gene regulatory elements with the unique, integration site-independent ability to transfer the characteristics of their locus-of-origin's gene expression pattern to a linked transgene in mice. LCR activities have been discovered in numerous T cell lineage-expressed gene loci. These elements can be adapted to the design of stem cell gene therapy vectors that direct robust therapeutic gene expression to the T cell progeny of engineered stem cells. Currently, transgenic mice provide the only experimental approach that wholly supports all the critical aspects of LCR activity. In this study, we report the manifestation of all key features of mouse TCR-α gene LCR function in T cells derived in vitro from mouse embryonic stem cells. High-level, copy number-related TCR-α LCR-linked reporter gene expression levels are cell type restricted in this system, and upregulated during the expected stage transition of T cell development. We also report that de novo introduction of TCR-α LCR-linked transgenes into existing T cell lines yields incomplete LCR activity. These data indicate that establishing full TCR-α LCR activity requires critical molecular events occurring prior to final T lineage determination. This study also validates a novel, tractable, and more rapid approach for the study of LCR activity in T cells, and its translation to therapeutic genetic engineering.


Figures

Figure 1
Figure 1. The TCRα LCR genomic region and reporter transgenes
(A) Diagram of the TCRα/Dad1 locus. Vertical arrows depict DNase hypersensitive sites (HS)1-8 of the TCRα LCR. The open box marks the Eα classical transcriptional enhancer. All other boxes indicate exons of their respective genes. Horizontal arrows indicate the transcription orientation of the genes. Diagram is drawn to scale. (B) Depiction of the hCD2ΔT and hCD2:1-8 transgenes. A premature stop codon (●) was introduced in exon V prior to the codons of the cytoplasmic tail (24) In hCD2:1-8, the TCRα LCR cassette (18) (open box) containing an exon-free HS1-8 fragment is linked to hCD2ΔT gene fragment.
Figure 2
Figure 2. TCRα LCR-dependent hCD2 reporter protein expression in T-cells differentiated from ES cell clones
(A) Flow cytometry analyses of hCD2 expression in three representative independent clones of ESC transfected with hCD2ΔT (ΔT) and subsequently differentiated into CD4,CD8 double positive (DP) and CD8 single positive (SP) T-cells. None of the clones produce T cells that are hCD2 positive (n=6). (B) DP and CD8 SP T cells derived from three representative independent ESC clones transfected with hCD2:1-8 are positive for hCD2 reporter protein. All hCD2:1-8 ESC clones (1-8:) produce T cells that express the hCD2 protein on their cell surface (n>12). Cell population gates are shown at left. hCD2 expression in transfected (dark curve) and non-transfected (light curve) gated cells is shown at right.
Figure 3
Figure 3. Cell type restriction on high-level hCD2:1-8 reporter transgene expression during in vitro hematopoiesis from ESCs
Flow cytometric analysis of in vitro differentiated hematopoeietic progeny of four representative hCD2:1-8ESC clones (1-8:). Monocytic (CD11bhiCD45+) and Erythroid (TER119+CD45neg) cells were harvested on day 12 of OP9+ESC co-culture and were low to negative for hCD2. DP T-cells (CD4+CD8+) were harvested on Day 18 of OP9DL1+ESC co-culture and were strongly positive for hCD2. Representative target cell population gates are shown at top. hCD2 expression in gated transfected (dark curve) and non-transfected (light curve) cells is shown below in each column.
Figure 4
Figure 4. Appropriate upregulation of the hCD2:1-8 reporter gene at DN3 or during the DN3 to DP stage transition of in vitro T cell development
Flow cytometry analysis of T cell development from four representative hCD2:1-8ESC clones (1-8:) differentiated in the OP9DL1 co-culture system. Cells were harvested on day 12 of co-culture to detect CD4, CD8 double negative (DN)1 (CD44+CD25neg) and DN2 (CD44+CD25+) stage T cells, or day 18 to examine DN3 (CD44negCD25+) and DP (CD4+CD8+) cells. Note that clone 1-8:A1 also appears in Figure 3. Representative target cell population gates are shown at top. hCD2 expression in gated transfected (dark curve) and non-transfected (light curve) cells is shown below in each column.
Figure 5
Figure 5. TCRα LCR drives copy number-related hCD2 reporter mRNA levels in T cells derived in vitro from ESCs
Quantitative (q)RT-PCR analysis of in vitro differentiated T cell progeny of representative hCD2:1-8ESC clones. Cells were harvested on day 20 of OP9DL1-ESC co-culture. (A) qRT-PCR results from T cells derived from five individual, independent hCD2:1-8ESC clones generated from an ESC transfection (Group 1). Copy number estimates are (L to R) 3, 6, 1, 2 and 3. Individual samples were run in triplicate in the qRT-PCR experiments. The y-axis signifies the relative mRNA levels detected in a given experiment with the highest level observed designated as “1.0”. Bars represent averages of three independent experiments (see Materials and Methods). The range of mRNA levels per transgene copy is 1.6-fold. (B) Graph of the correlation between relative mRNA level and transgene copy number. Prism (Graphpad) software was used to calculate x-y value correlation (r) and significance (p) noted on the graphs. The p-value was derived from an “F test” on the linear relationship between x and y values. (C) qRT-PCR results [analyzed and depicted as in (A)] from T cells derived from seven additional individual, independent hCD2:1-8ESC clones generated from an additional, independent ESC transfection (Group 2). Copy number estimates are (L to R) 2, 4, 1, 3, 3, 2 and 2. The range of mRNA levels per transgene copy is 1.6-fold. (D) Graph of correlation between relative mRNA level and transgene copy number [analyzed and depicted as in (B)].
Figure 6
Figure 6. TCRα LCR driven reporter mRNA levels are not copy number-related after de novo transfection into established T-cell lines
(A) qRT-PCR analysis of clones of a CD4, CD8 DP T cell line, VL3-3M2, transfected with the hCD2:1-8 reporter gene. Copy number estimates are (L to R) 8, 3, 1, 13 and 10. Individual samples were run in triplicate in the qRTPCR experiments. The y-axis shows relative mRNA levels detected in a given experiment with the highest level observed designated as “1.0”. Bars represent averages of three independent experiments (see Materials and Methods). The range of mRNA levels per copy is 5.5-fold. (B) Graph of the correlation between relative mRNA level and transgene copy number [analyzed and depicted as in Figure 5B, 5D]. (C) qRT-PCR results [analyzed and depicted as in (A)] of clones of C6VLB (a CD4+ T cell line) transfected with the hCD2:1-8 reporter gene. Copy number estimates are (L to R) 4, 3, 4, 6, 1, and 2. The range of mRNA levels per transgene copy is over 80-fold. (D) Graph of the correlation between relative mRNA level and transgene copy number [analyzed and depicted as in Figure 5B, 5D].

Similar articles

Cited by

References

    1. Li Q, Peterson KR, Fang X, Stamatoyannopoulos G. Locus Control Regions. Blood. 2002;100:3077–3086. - PMC - PubMed
    1. Festenstein R, Tolaini M, Corbella P, Mamalaki C, Parrington J, Fox M, Miliou A, Jones M, Kioussis D. Locus control region function and heterochromatin-induced position effect variegation. Science. 1996;271:1123–1125. - PubMed
    1. Milot E, Strouboulis J, Trimborn T, Wijgerde M, de Boer E, Langeveld A, Tan-Un K, Vergeer W, Yannoutsos N, Grosveld F, Fraser P. Heterochromatin effects on the frequency and duration of LCR-mediated gene transcription. Cell. 1996;87:105–114. - PubMed
    1. Grosveld F, van Assendelft GB, Greaves DR, Kollias G. Position-independent, high-level expression of the human beta-globin gene in transgenic mice. Cell. 1987;51:975–985. - PubMed
    1. Lang G, Wotton D, Owen MJ, Sewell WA, Brown MH, Mason DY, Crumpton MJ, Kioussis D. The structure of the human CD2 gene and its expression in transgenic mice. EMBO J. 1988;7:1675–1682. - PMC - PubMed

Publication types

MeSH terms

Substances