

MicroRNA regulation and its effects on cellular transcriptome in human immunodeficiency virus-1 (HIV-1) infected individuals with distinct viral load and CD4 cell counts
- PMID: 23721325
- PMCID: PMC3680326
- DOI: 10.1186/1471-2334-13-250
MicroRNA regulation and its effects on cellular transcriptome in human immunodeficiency virus-1 (HIV-1) infected individuals with distinct viral load and CD4 cell counts
Abstract
Background: Disease progression in the absence of therapy varies significantly in HIV-1 infected individuals. Both viral and host cellular molecules are implicated; however, the exact role of these factors and/or the mechanism involved remains elusive. To understand how microRNAs (miRNAs), which are regulators of transcription and translation, influence host cellular gene expression (mRNA) during HIV-1 infection, we performed a comparative miRNA and mRNA microarray analysis using PBMCs obtained from infected individuals with distinct viral load and CD4 counts.
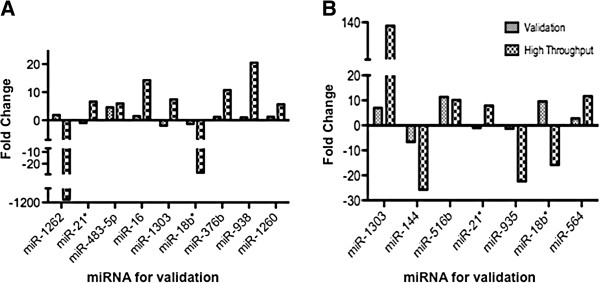
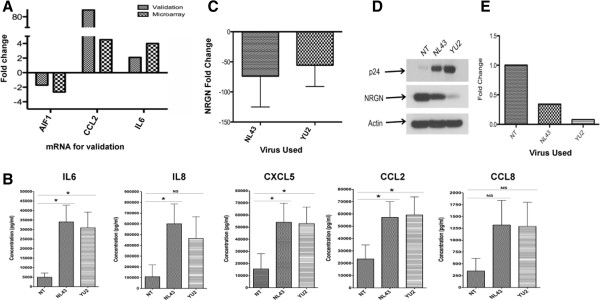
Methods: RNA isolated from PBMCs obtained from HIV-1 seronegative and HIV-1 positive individuals with distinct viral load and CD4 counts were assessed for miRNA and mRNA profile. Selected miRNA and mRNA transcripts were validated using in vivo and in vitro infection model.
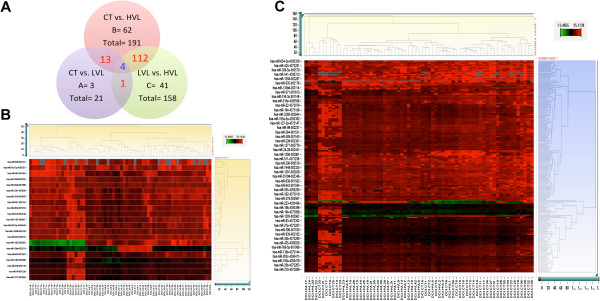
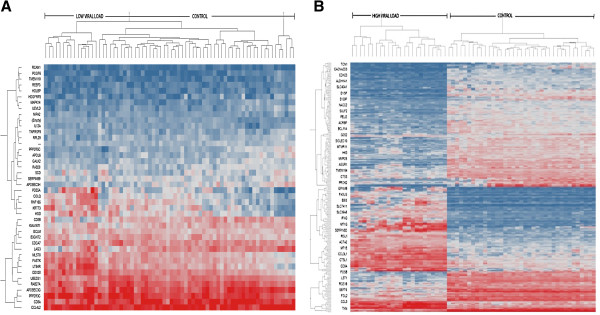
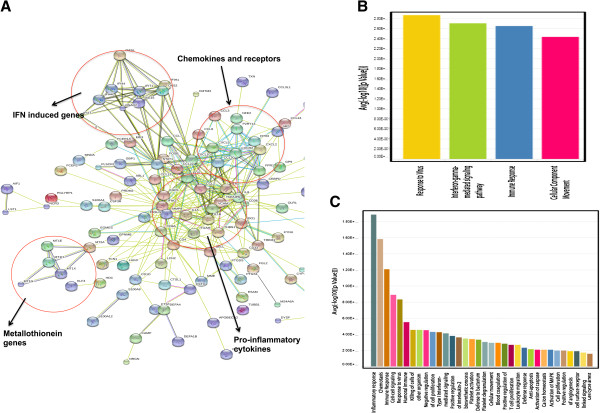
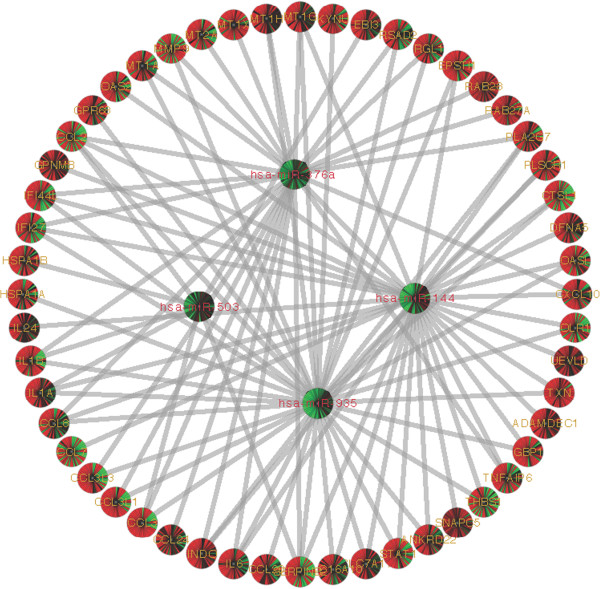
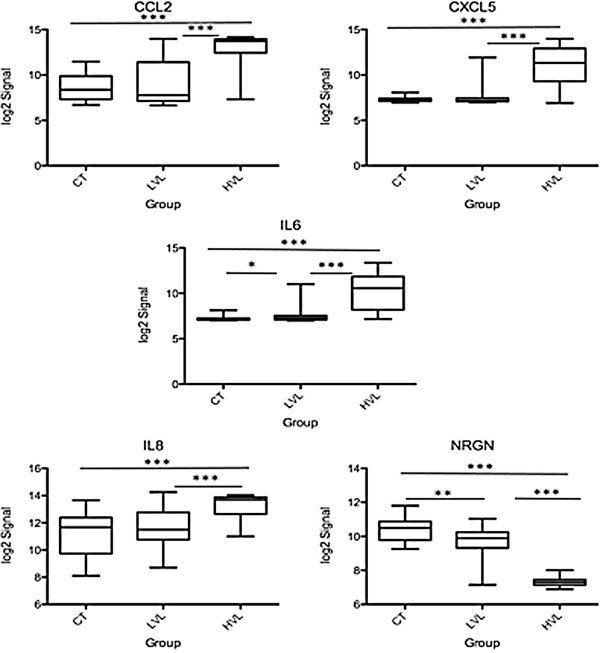
Results: Our results indicate that HIV-1 positive individuals with high viral load (HVL) showed a dysregulation of 191 miRNAs and 309 mRNA transcripts compared to the uninfected age and sex matched controls. The miRNAs miR-19b, 146a, 615-3p, 382, 34a, 144 and 155, that are known to target innate and inflammatory factors, were significantly upregulated in PBMCs with high viral load, as were the inflammatory molecules CXCL5, CCL2, IL6 and IL8, whereas defensin, CD4, ALDH1, and Neurogranin (NRGN) were significantly downregulated. Using the transcriptome profile and predicted target genes, we constructed the regulatory networks of miRNA-mRNA pairs that were differentially expressed between control, LVL and HVL subjects. The regulatory network revealed an inverse correlation of several miRNA-mRNA pair expression patterns, suggesting HIV-1 mediated transcriptional regulation is in part likely through miRNA regulation.
Conclusions: Results from our studies indicate that gene expression is significantly altered in PBMCs in response to virus replication. It is interesting to note that the infected individuals with low or undetectable viral load exhibit a gene expression profile very similar to control or uninfected subjects. Importantly, we identified several new mRNA targets (Defensin, Neurogranin, AIF) as well as the miRNAs that could be involved in regulating their expression through the miRNA-mRNA interaction.
Figures
Similar articles
-
Relationships of PBMC microRNA expression, plasma viral load, and CD4+ T-cell count in HIV-1-infected elite suppressors and viremic patients.Retrovirology. 2012 Jan 12;9:5. doi: 10.1186/1742-4690-9-5. Retrovirology. 2012. PMID: 22240256 Free PMC article.
-
Differential microRNA expression profile between stimulated PBMCs from HIV-1 infected elite controllers and viremic progressors.PLoS One. 2014 Sep 16;9(9):e106360. doi: 10.1371/journal.pone.0106360. eCollection 2014. PLoS One. 2014. PMID: 25225963 Free PMC article.
-
Identification of miRNA-mRNA crosstalk in CD4+ T cells during HIV-1 infection by integrating transcriptome analyses.J Transl Med. 2017 Feb 21;15(1):41. doi: 10.1186/s12967-017-1130-y. J Transl Med. 2017. PMID: 28222782 Free PMC article.
-
MiRNA expression profiling in HIV pathogenesis, disease progression and response to treatment: a systematic review.Epigenomics. 2021 Oct;13(20):1653-1671. doi: 10.2217/epi-2021-0237. Epub 2021 Oct 25. Epigenomics. 2021. PMID: 34693727
-
The Role of MicroRNAs in HIV Infection.Genes (Basel). 2024 Apr 29;15(5):574. doi: 10.3390/genes15050574. Genes (Basel). 2024. PMID: 38790203 Free PMC article. Review.
Cited by
-
Expression of microRNAs 16, 20a, 150 and 155 in anal squamous intraepithelial lesions from high-risk groups.Sci Rep. 2019 Feb 6;9(1):1523. doi: 10.1038/s41598-018-38378-6. Sci Rep. 2019. PMID: 30728437 Free PMC article.
-
Gene Expression: the Key to Understanding HIV-1 Infection?Microbiol Mol Biol Rev. 2020 May 13;84(2):e00080-19. doi: 10.1128/MMBR.00080-19. Print 2020 May 20. Microbiol Mol Biol Rev. 2020. PMID: 32404327 Free PMC article. Review.
-
HIV/neuroAIDS biomarkers.Prog Neurobiol. 2017 Oct;157:117-132. doi: 10.1016/j.pneurobio.2016.04.003. Epub 2016 Apr 12. Prog Neurobiol. 2017. PMID: 27084354 Free PMC article. Review.
-
Induction of the pro-inflammatory NF-kB-sensitive miRNA-146a by human neurotrophic viruses.Front Microbiol. 2015 Feb 3;6:43. doi: 10.3389/fmicb.2015.00043. eCollection 2015. Front Microbiol. 2015. PMID: 25691883 Free PMC article. No abstract available.
-
Anti-HIV microRNA expression in a novel Indian cohort.Sci Rep. 2016 Jun 20;6:28279. doi: 10.1038/srep28279. Sci Rep. 2016. PMID: 27320691 Free PMC article. Clinical Trial.
References
-
- Nowak MA. Variability of HIV infections. J Theor Biol. 1992;155(1):1–20. - PubMed
-
- Salgado M, Lopez-Romero P, Callejas S, Lopez M, Labarga P, Dopazo A, Soriano V, Rodes B. Characterization of host genetic expression patterns in HIV-infected individuals with divergent disease progression. Virology. 2011;411(1):103–112. - PubMed
Publication types
MeSH terms
Substances
Grants and funding
LinkOut - more resources
Full Text Sources
Other Literature Sources
Medical
Research Materials
Miscellaneous
