. 2013 Jun 25;7(6):5320-9.
doi: 10.1021/nn4011686. Epub 2013 May 30.

Photosensitizer-loaded gold vesicles with strong plasmonic coupling effect for imaging-guided photothermal/photodynamic therapy

Affiliations

Photosensitizer-loaded gold vesicles with strong plasmonic coupling effect for imaging-guided photothermal/photodynamic therapy

Jing Lin et al. ACS Nano. .

Abstract

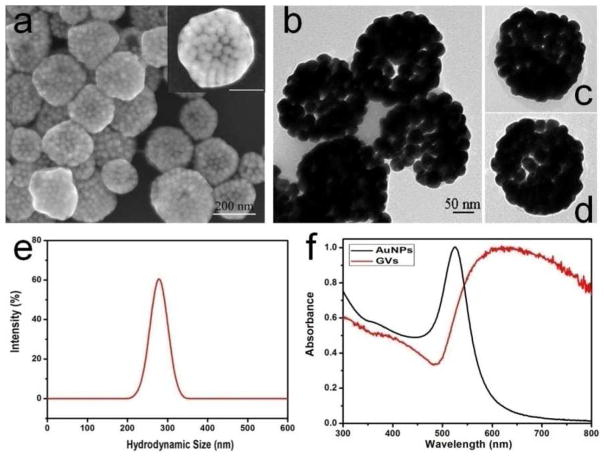
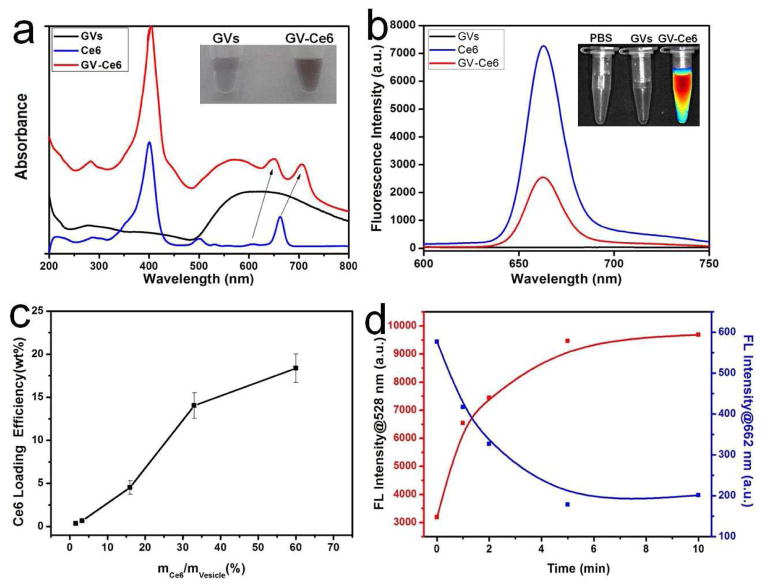
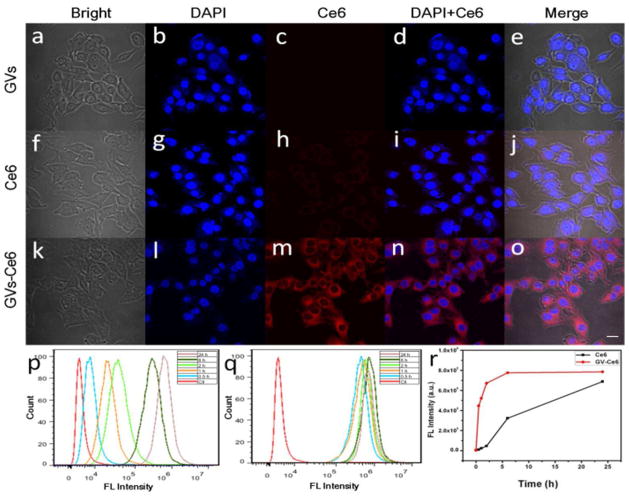
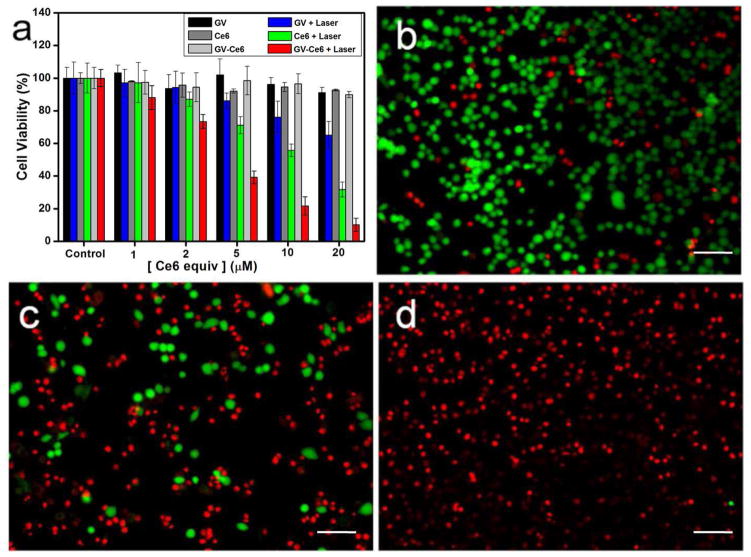
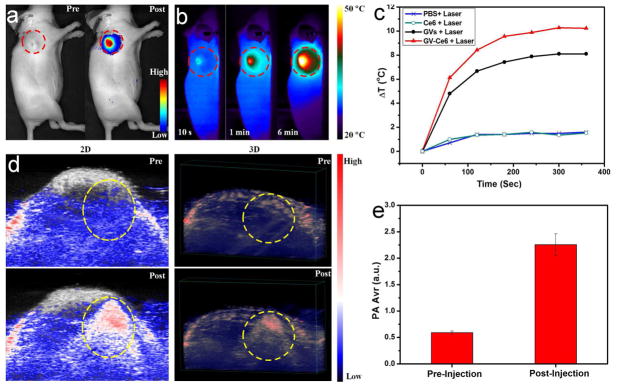
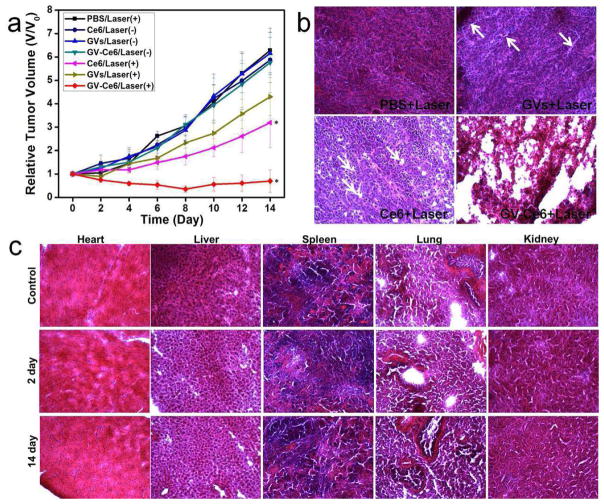
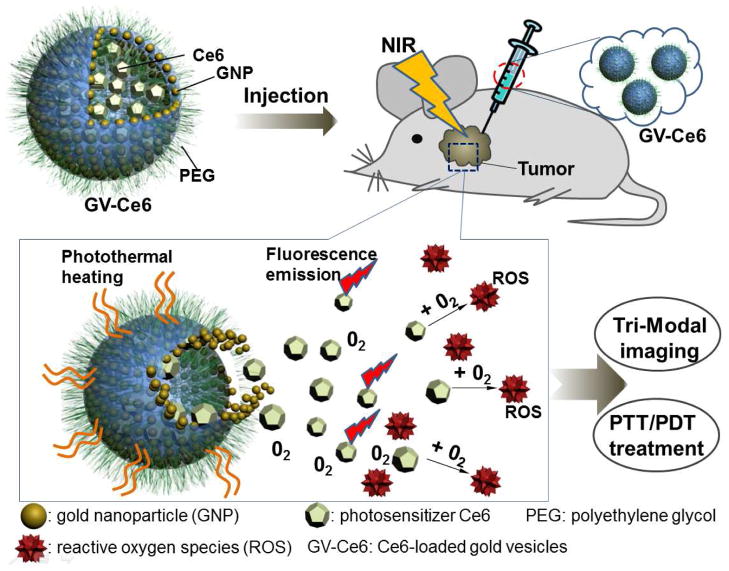
A multifunctional theranostic platform based on photosensitizer-loaded plasmonic vesicular assemblies of gold nanoparticles (GNPs) is developed for effective cancer imaging and treatment. The gold vesicles (GVs) composed of a monolayer of assembled GNPs show strong absorbance in the near-infrared (NIR) range of 650-800 nm, as a result of the plasmonic coupling effect between neighboring GNPs in the vesicular membranes. The strong NIR absorption and the capability of encapsulating photosensitizer Ce6 in GVs enable trimodality NIR fluorescence/thermal/photoacoustic imaging-guided synergistic photothermal/photodynamic therapy (PTT/PDT) with improved efficacy. The Ce6-loaded GVs (GV-Ce6) have the following characteristics: (i) high Ce6 loading efficiency (up to ~18.4 wt %; (ii) enhanced cellular uptake efficiency of Ce6; (iii) simultaneous trimodality NIR fluorescence/thermal/photoacoustic imaging; (iv) synergistic PTT/PDT treatment with improved efficacy using single wavelength continuous wave laser irradiation.


Figures

Figure 1
Figure 1
(a) SEM and (b–d) TEM images of plasmonic gold vesicles (GVs) self-assembled from 20 nm GNPs. (e) Size distribution of GVs by DLS; (d) UV-vis spectra of BCP-tethered GNPs and GVs.
Figure 2
Figure 2
(a) UV-vis spectra of GVs (black), Ce6 (blue) and GV-Ce6 (red). The arrows indicate characteristic Q-bands of Ce6; (b) Fluorescence emission spectra of GVs, Ce6 and GV-Ce6; (c) Ce6 loading efficiency of GV-Ce6 as a function of Ce6 concentration; (d) The changes of fluorescence intensity at the characteristic peaks of SOSG and Ce6 (528 and 662 nm) as a function of laser irradiation time.
Figure 3
Figure 3
Subcellular localization of GVs (a–e), Ce6 (f–j) and GV-Ce6 (k–t) in MDA-MB-435 cells. (a, f, k) Bright field; (b, g, l) Nuclei fluorescence (DAPI); (c, h, m) Ce6 fluorescence; (d, i, n) Merged images of b and c, g and h; l and m; (e, j, o) Merged images of a, b and c; f, g and h; k, l and m. The scale bar is 20 μm. (p, q) Ce6 fluorescence in cells after incubation with pure Ce6 (p) and GV-Ce6 (q) at different timepoints; (r) The changes of Ce6 fluorescence intensity in cells as a function of incubation time.
Figure 4
Figure 4
(a) MDA-MB-435 cell viability at different concentrations of GVs, Ce6, and GV-Ce6 for 12 h at 37 °C with or without irradiation for 3 min with a 671 nm laser (2 W/cm2). Fluorescence images of Calcein AM and Ethidium homodimer-1 co-staining cancer cells incubated with (b) GVs (36.8 μg/mL), (c) Ce6 (10 μM), and (d) GV-Ce6 at a Ce6 concentration of 10 μM for 12 h at 37 °C after irradiation. Scale bars: 50 μm.
Figure 5
Figure 5
(a) In vivo NIR fluorescence image of MDA-MB-435 tumor-bearing mice at pre-injection and post-injection of GV-Ce6. (b) Thermal images of tumor-bearing mice exposed to 671 nm laser (2.0 W/cm2) for 6 min at post-injection of GV-Ce6. Red circles indicate the location of tumors. (c) Heating curves of tumors upon laser irradiation as a function of irradiation time. (d) In vivo photoacoustic (PA) images and (e) average PA intensity of tumor tissues at pre-injection and post-injection of GV-Ce6. Yellow circles indicate the injected location.
Figure 6
Figure 6
(a) Tumor growth curves of different groups of tumor-bearing mice after treatment. Tumor volumes were normalized to their initial sizes. Error bars represent the standard deviations of 4–6 mice per group. Asterisk indicates P < 0.05. (b) H&E stained tumor sections collected from different groups of mice 14 days post treatment. Arrows indicate the sporadic necrotic areas. (c) H&E stained images of major organs collected from control and GV-Ce6 administrated and irradiated mice at 2 and 14 days post treatment.
Scheme 1
Scheme 1
Photosensitizer (Ce6)-loaded plasmonic gold vesicles (GVs) for tri-modality fluorescence/thermal/photoacoustic imaging guided synergistic photothermal/photodynamic cancer therapy.

References

    1. Lovell JF, Liu T, Chen J, Zheng G. Activatable Photosensitizers for Imaging and Therapy. Chem Rev. 2010;110:2839–2857. - PubMed
    1. Celli JP, Spring BQ, Rizvi I, Evans CL, Samkoe KS, Verma S, Pogue BW, Hasan T. Imaging and Photodynamic Therapy: Mechanisms, Monitoring and Optimization. Chem Rev. 2010;110:2795–2838. - PMC - PubMed
    1. Rai P, Mallidi S, Zheng X, Rahmanzadeh R, Mir Y, Elrington S, Khurshid A, Hasan T. Development and Applications of Photo-Triggered Theranostic Agents. Adv Drug Deliver Rev. 2010;62:1094–1124. - PMC - PubMed
    1. Xie J, Lee S, Chen X. Nanoparticle-Based Theranostic Agents. Adv Drug Deliver Rev. 2010;62:1064–1079. - PMC - PubMed
    1. Kelkar SS, Reineke TM. Theranostics: Combining Imaging and Therapy. Bioconjugate Chem. 2011;22:1879–1903. - PubMed

Publication types

MeSH terms