Review
. 2013 Jun;10(6):515-23.
doi: 10.1038/nmeth.2477.

Mapping brain circuitry with a light microscope

Affiliations
Review

Mapping brain circuitry with a light microscope

Pavel Osten et al. Nat Methods. 2013 Jun.

Abstract

The beginning of the 21st century has seen a renaissance in light microscopy and anatomical tract tracing that together are rapidly advancing our understanding of the form and function of neuronal circuits. The introduction of instruments for automated imaging of whole mouse brains, new cell type–specific and trans-synaptic tracers, and computational methods for handling the whole-brain data sets has opened the door to neuroanatomical studies at an unprecedented scale. We present an overview of the present state and future opportunities in charting long-range and local connectivity in the entire mouse brain and in linking brain circuits to function.


Figures

Figure 1
Figure 1
Whole-brain LM methods. (a) STP tomography. Two-photon microscope is used to image the mouse brain in a coronal plane in a mosaic grid pattern and microtome sections off the imaged tissue. Piezo objective scanner can be used for z-stack imaging (image adapted from Ragan et al.). (b) fMOST. Confocal line-scan is used to image the brain as 1 µm thin section cut by diamond knife (image adapted from Gong et al.). (c) LSFM. The cleared brain is illuminated from the side with the light sheet (blue) through an illumination objective (or cylinder lens) and imaged in a mosaic grid pattern from top (image adapted from Niedworok et al.). In all instruments, the brain is moved under the objective on motorized XYZ stage; PMT, photomultiplier tube.
Figure 2
Figure 2
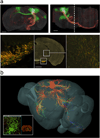
Primary motor cortex (MOp) projection maps. (a) Mouse Brain Architecture (http://brainarchitecture.org) data of AAV-GFP injected into the supragranular layers and AAV-RFP injected in the infragranular layers (F. Mechler and P. Mitra, CSHL, unpublished data). Top panels show frontal (left) and lateral (right) views of the volume-rendered brain (scale bars = 1000 µm); bottom panels show high-zoom views of the regions highlighted in the central image: axonal fibers in the cerebral peduncle (left) and projections to the midbrain reticular nucleus (right) (scales bar = 20 µm). (b) Mouse Connectivity (http://connectivity.brain-map.org) data of a similar AAV-GFP injection show the MOp projectome reconstructed in the Allen Brain Explorer (H. Zeng, AIBS, unpublished data). The lower left inset shows high-zoom view and coronal section overview of projections in the ventral posteromedial nucleus of the thalamus (VPM)..
Figure 3
Figure 3
Mapping the function and connectivity of single cells in the mouse brain in vivo. a) Patch pipettes–with internal solutions containing DNA vectors used to drive the expression of the TVA and RV-G proteins–are used to perform a whole-cell recording of the intrinsic and sensory-evoked synaptic properties of a single Layer 5 neuron in primary visual cortex (b). Following the recording, the encapsulated modified rabies virus is injected into the brain in close proximity to the recorded neuron. c) After a period of up to 12 days that ensures retrograde spread of the modified rabies from the recorded neuron, the brain is removed and imaged for identification of the local and long-range presynaptic inputs underlying the tuning of the recorded neuron to the direction of visual motion (polar plot). (top and bottom scale bar = 300 and 50 µm, respectively) Images modified from Rancz et al., 2011.
Figure 4
Figure 4
Imaging c-fos induction as a means to map whole-brain activation. (a) 3D visualization of 367,378 c-fos-GFP cells detected in 280 coronal sections of an STP tomography dataset of a mouse brain after novelty exploration. (b) Examples of anatomical segmentation of the brain volume with the Allen Mouse Brain Reference Atlas labels modified for the 280-section STP tomography datasets: hippocampus (blue), prelimbic (aqua blue), infralimbic (orange) and piriform (green) cortex. (c) Visualization of c-fos-GFP cells in the hippocampus (38,170 cells), prelimbic (3,305 cells), infralimbic (3,827 cells) and piriform (10,910 cells) cortex (P. Osten, Y. Kim, K. Umadevi Venkataraju, CSHL, unpublished data).

References

    1. Golgi C. Sulla struttura della sostanza grigia del cervello. Gazz Med Ital (Lombardia) 1873;33:244–246.
    1. Ramón Y, Cajal S. Textura del sistema nervioso del hombre y de los vertebrados. Vol. 2. Moya; 1904.
    1. Felleman DJ, Van Essen DC. Distributed hierarchical processing in the primate cerebral cortex. Cerebral cortex. 1991;1:1–47. - PubMed
    1. Rockland KS, Pandya DN. Laminar origins and terminations of cortical connections of the occipital lobe in the rhesus monkey. Brain research. 1979;179:3–20. - PubMed
    1. Milham M, et al. Human Connectome review. Nature methods. 2013;XX:X.

Publication types