. 2013 Jul 5;341(6141):88-91.
doi: 10.1126/science.1238856. Epub 2013 May 30.

Engineered SIRPα variants as immunotherapeutic adjuvants to anticancer antibodies

Affiliations

Engineered SIRPα variants as immunotherapeutic adjuvants to anticancer antibodies

Kipp Weiskopf et al. Science. .

Abstract

CD47 is an antiphagocytic signal that cancer cells employ to inhibit macrophage-mediated destruction. Here, we modified the binding domain of human SIRPα, the receptor for CD47, for use as a CD47 antagonist. We engineered high-affinity SIRPα variants with about a 50,000-fold increased affinity for human CD47 relative to wild-type SIRPα. As high-affinity SIRPα monomers, they potently antagonized CD47 on cancer cells but did not induce macrophage phagocytosis on their own. Instead, they exhibited remarkable synergy with all tumor-specific monoclonal antibodies tested by increasing phagocytosis in vitro and enhancing antitumor responses in vivo. This "one-two punch" directs immune responses against tumor cells while lowering the threshold for macrophage activation, thereby providing a universal method for augmenting the efficacy of therapeutic anticancer antibodies.


Figures

Fig. 1
Fig. 1. Directed evolution of high-affinity SIRPα variants
A Schematic of CD47 blockade by soluble high-affinity SIRPα. (Left) In the basal state, CD47 expression on cancer cells activates SIRPα on macrophages, initiating an inhibitory cascade through SHP 1 and 2 tyrosine phosphatases and preventing cancer cell phagocytosis. (Right) Soluble, high-affinity SIRPα protein competitively antagonizes CD47 and prevents engagement with SIRPα on macrophages, thereby disinhibiting phagocytosis. B Schematic representation of yeast surface-display of the human SIRPα V-set Ig domain (domain 1). Yeast clones (grey cells) present different variants of SIRPα (colored bumps). Inset indicates the linkage of SIRPα to the yeast cell surface via fusion with Aga2 and selection with biotinylated CD47. C Summary of sequences and SPR affinity measurements of engineered SIRPα variants. The position of the mutated residues and their corresponding sequence in wild-type allele 1 is denoted at the top of the table. Red text color indicates the consensus mutations and blue shading indicates contact residues in the consensus. Representative SPR sensorgrams of wild-type SIRPα and high-affinity variant FD6 binding immobilized CD47 are shown to the right. RU = response units. D The crystal structure of the FD6:CD47 complex depicted as transparent surfaces containing ribbon representations of FD6 (orange) and CD47 (blue). E Superimposition of the wild-type (magenta) and high-affinity (green) SIRPα:CD47 complexes. Insets show mutated contact residues in the SIRPα C′D loop (sticks) and the binding interface of CD47 (top, space fill; bottom, sticks).
Fig. 2
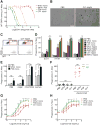
Fig. 2. High-affinity SIRPα variants lower the threshold for macrophage phagocytosis
A Dose-response curves of CD47 antagonism on Raji lymphoma cells with wild-type SIRPα allele 1 (WTa1, pink), anti-CD47 clone B6H12 Fab fragments (orange), or two high-affinity SIRPα variants as monomers (FD6, CV1, green). Cells stained with varying concentrations of CD47 blocking agents in competition with 100 nM Alexa Fluor 647-conjugated WT SIRPα tetramer. B Representative images of phagocytosis assays performed with GFP+ DLD-1 colon cancer cells and primary human macrophages with vehicle control (PBS) or a high-affinity SIRPα variant fused to human IgG4 (CV1-hIgG4). Black arrows and inset show macrophages with ingested cancer cells. Scale bar = 100 μm. C Representative plots showing phagocytosis assays analyzed by flow cytometry. Phagocytosis was quantified as the percentage of macrophages (blue gate) that became GFP+ (red gate). D Phagocytosis of GFP+ tumor cells by donor-derived human macrophages as assessed by flow cytometry. All protein treatments used at 100 nM. E Phagocytosis of GFP+ DLD-1 cells with vehicle, non-specific isotype control (mIgG1), non-blocking anti-CD47 (2D3), or anti-EpCam antibodies. All antibodies were used at 20 μg/mL. WTa1 SIRPα or high-affinity SIRPα variant FD6 monomers were combined as indicated. F Phagocytosis of GFP+ SK-BR-3 breast cancer cells with vehicle, WTa1 SIRPα or high-affinity SIRPα monomers alone or in combination with 1 μg/mL trastuzumab. G Phagocytosis of GFP+ DLD-1 cells with varying concentrations of cetuximab (anti-EGFR) alone (red) or in combination with WTa1 SIRPα monomer (pink) or high-affinity SIRPα monomers (green). G Phagocytosis of GFP+ Raji cells with varying concentrations of rituximab (anti-CD20) alone (red) or in the presence of WTa1 SIRPα monomer (pink) or high-affinity SIRPα monomers (green). B-H All human macrophage phagocytosis assays were performed with macrophages derived from a minimum of three independent blood donors. The percentage of GFP+ macrophages was normalized to the maximal response by each donor for each cell line. Error bars indicate standard deviation. E-H All SIRPα variants were used at 1 μM. ns = not significant, *p<0.05, **p<0.01, ***p<0.001 versus WT SIRPα variants, or as indicated otherwise.
Fig. 3
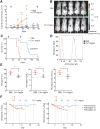
Fig. 3. High-affinity SIRPα-Fc fusion proteins are effective as single agents but produce toxicity
AGrowth of GFP-luciferase+ 639-V bladder cancer cells in the dorsal subcutaneous tissue of NSG mice upon daily treatment with vehicle control (PBS) or high-affinity SIRPα-Fc (CV1-hIgG4) as evaluated by bioluminescence imaging. Bars indicate median values, points depict individual mice. Black arrows depict start and stop of treatment. B Representative bioluminescence images of 639-V-engrafted mice from each treatment group on day 37 post-engraftment. C Survival of mice engrafted with GFP-luciferase+ 639-V cells. Black arrows indicate the start and stop of treatment. D Representative FACS analysis of human Fc bound to the surface of whole blood cells from treated animals. E Analysis of red blood cell parameters from treated animals showing mean and standard deviation from five animals per cohort. Dotted lines show lower limit of normal values. F Blood analysis of cynomolgus macaques treated with the indicated high-affinity SIRPα variants over time. Dotted lines indicate days of treatment with the doses indicated above in mg/kg. Data depicted as percentage of pre-treatment values. FD6-hIgG4 animal #2 was pre-treated with erythropoietin prior to toxicity testing. ns = not significant, *p<0.05, **p<0.01, ***p<0.001 for vehicle control versus CV1-hIgG4.
Fig. 4
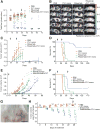
Fig. 4. High-affinity SIRPα monomers enhance the efficacy of therapeutic antibodiesin vivo
A Growth of GFP-luciferase+ Raji lymphoma tumors upon daily treatment with PBS (red), CV1 monomer (orange), rituximab (green), or rituximab plus CV1 monomer (blue), as evaluated by bioluminescence imaging. Bars indicate median values, points indicate values from individual mice. B Representative bioluminescence images of treated mice on day 29 post-engraftment. Red circles indicate sites of primary tumors, red arrow indicates site of metastases to axillary lymph nodes. C Mean tumor volume measurements of treated mice. Error bars depict standard deviation. D Survival of treated animals over time. E Growth of Raji lymphoma tumors upon biweekly treatment with PBS (red), CV1 monomer (orange), alemtuzumab (green), or alemtuzumab plus CV1 monomer (blue), as evaluated by tumor volume. Bars indicate median values, points indicate values from individual mice. F Survival of lymphoma-bearing mice from E. G Representative image of Her2/neu+ BT474M1 human breast tumors engrafted into the mammary tissue of NSG mice prior to treatment. Scale bar represents approximately 1 cm. H Logarithmic fold-change in breast tumor volume upon treatment with the indicated therapeutic regimens. Bars indicate median values, points indicate values from individual mice. A-F Black arrows indicate the start and stop of the treatment period. ns = not significant, *p<0.05, **p<0.01, ***p<0.001, ****p<0.0001 for antibody alone versus antibody+CV1 monomer combination, or as indicated otherwise.

Comment in

References

    1. Hanahan D, Weinberg RA. Hallmarks of cancer: the next generation. Cell. 2011;144:646. - PubMed
    1. Leach DR, Krummel MF, Allison JP. Enhancement of antitumor immunity by CTLA-4 blockade. Science. 1996;271:1734. - PubMed
    1. Korman AJ, Peggs KS, Allison JP. Checkpoint blockade in cancer immunotherapy. Adv Immunol. 2006;90:297. - PMC - PubMed
    1. Beatty GL, et al. CD40 agonists alter tumor stroma and show efficacy against pancreatic carcinoma in mice and humans. Science. 2011;331:1612. - PMC - PubMed
    1. Oldenborg PA, et al. Role of CD47 as a marker of self on red blood cells. Science. 2000;288:2051. - PubMed

Publication types

MeSH terms

Associated data