. 2013 Jul;123(7):2981-93.
doi: 10.1172/JCI67390. Epub 2013 Jun 3.

Peptidylarginine deiminase inhibition is immunomodulatory and vasculoprotective in murine lupus

Affiliations

Peptidylarginine deiminase inhibition is immunomodulatory and vasculoprotective in murine lupus

Jason S Knight et al. J Clin Invest. 2013 Jul.

Abstract

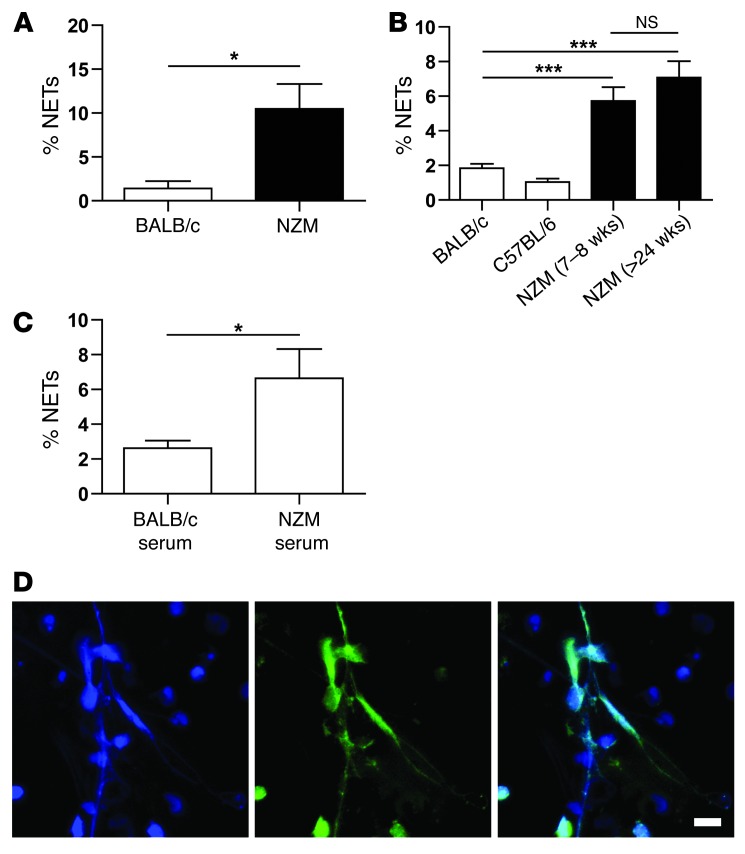
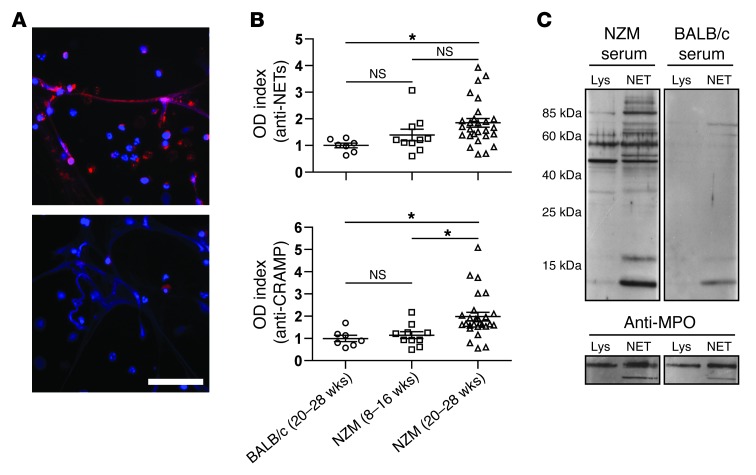
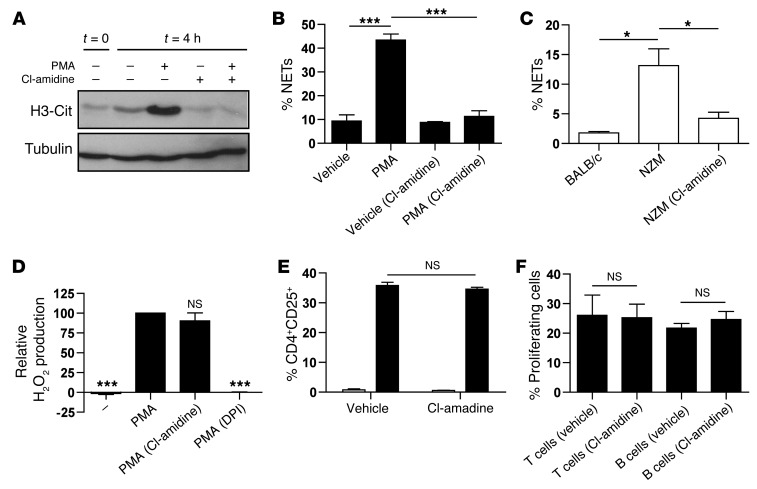
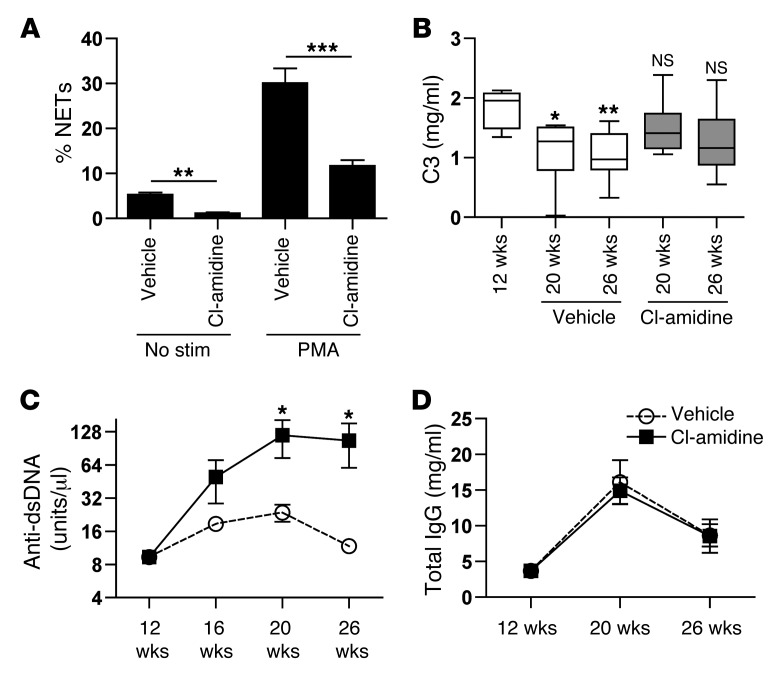
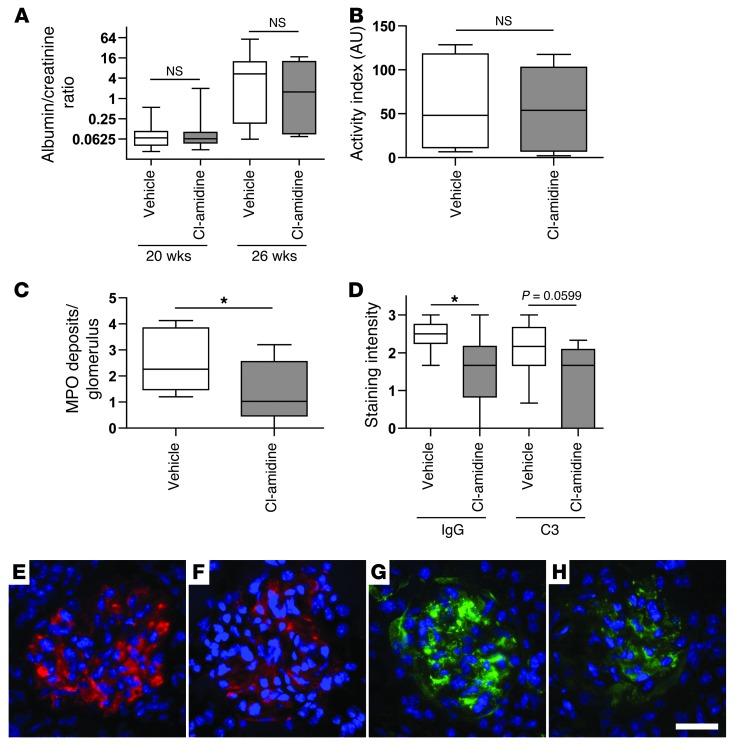
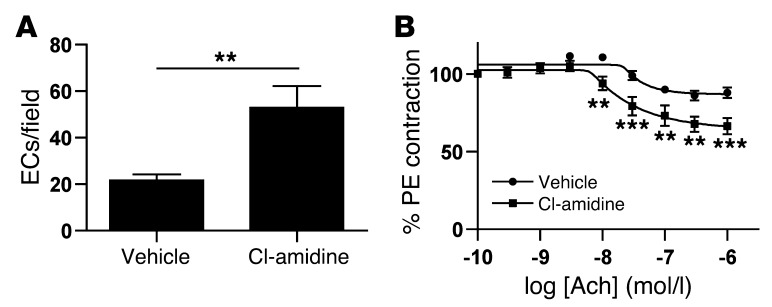
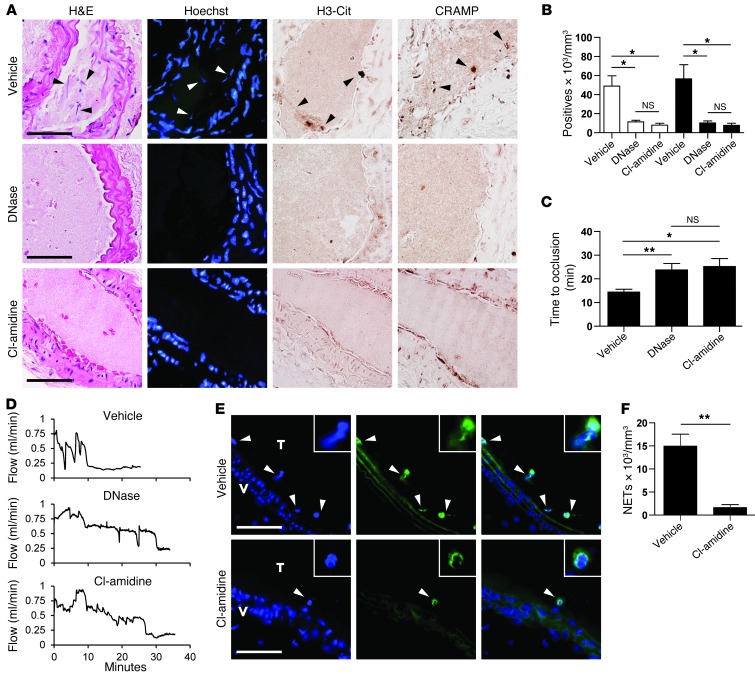
Recent evidence suggests that enhanced neutrophil extracellular trap (NET) formation activates plasmacytoid dendritic cells and serves as a source of autoantigens in SLE. We propose that aberrant NET formation is also linked to organ damage and to the premature vascular disease characteristic of human SLE. Here, we demonstrate enhanced NET formation in the New Zealand mixed 2328 (NZM) model of murine lupus. NZM mice also developed autoantibodies to NETs as well as the ortholog of human cathelicidin/LL37 (CRAMP), a molecule externalized in the NETs. NZM mice were treated with Cl-amidine, an inhibitor of peptidylarginine deiminases (PAD), to block NET formation and were evaluated for lupus-like disease activity, endothelial function, and prothrombotic phenotype. Cl-amidine treatment inhibited NZM NET formation in vivo and significantly altered circulating autoantibody profiles and complement levels while reducing glomerular IgG deposition. Further, Cl-amidine increased the differentiation capacity of bone marrow endothelial progenitor cells, improved endothelium-dependent vasorelaxation, and markedly delayed time to arterial thrombosis induced by photochemical injury. Overall, these findings suggest that PAD inhibition can modulate phenotypes crucial for lupus pathogenesis and disease activity and may represent an important strategy for mitigating cardiovascular risk in lupus patients.


Figures

Figure 1
Figure 1. NZM neutrophils show enhanced release of NETs.
Peripheral blood (A) or bone marrow (B) neutrophils from NZM, BALB/c, or C57BL/6 mice were incubated in the absence of serum for 4 hours. Unless otherwise indicated, mice were more than 24 weeks old. (C) BALB/c neutrophils were incubated with 2% serum from mice older than 24 weeks for 4 hours. In all experiments, NET formation was quantified by fluorescence microscopy as described in Methods. For all experiments, data are shown as mean ± SEM, and at least 3 independent experiments are represented. *P < 0.05; ***P < 0.001. (D) Representative fluorescence microscopy image showing NET release from NZM neutrophils. DNA is stained blue, and neutrophil elastase is stained green. The right panel overlays the 2 colors. Original magnification, ×400. Scale bar: 10 microns.
Figure 2
Figure 2. NZM IgG binds to NETs and to proteins derived from NETs.
(A) Paraformaldehyde-fixed NZM NETs were incubated with 1% serum from NZM (top panel) or BALB/c (bottom panel) mice more than 24 weeks old. Bound IgG was detected with Texas red–conjugated anti-mouse IgG. DNA is stained blue with Hoechst 33342. Original magnification, ×400. Scale bar: 50 microns. (B) Serum was tested for autoantibodies to NETs or CRAMP as described in Methods. OD index compares absorbance to the mean value for BALB/c controls. Each data point represents an individual mouse, with mean and SEM shown for each group. *P < 0.05. (C) NETs were generated as described in Methods. 20 μg of either NET protein or unstimulated neutrophil lysate (Lys) was resolved by 15% SDS-PAGE and probed with 0.5% NZM or BALB/c serum; bands were detected with HRP-conjugated anti-mouse IgG. Blots were also probed with anti-MPO to ensure equal loading. Data in A and C are representative of at least 3 independent experiments.
Figure 3
Figure 3. PAD inhibition blocks NZM NET formation in vitro.
(A) Cl-amidine treatment inhibits histone H3 citrullination. NZM bone marrow neutrophils were treated with 100 nM PMA in the presence or absence of 200 μM Cl-amidine. Whole-cell lysates were resolved by SDS-PAGE. A Western blot representative of 3 independent experiments is shown. H3-Cit, citrullinated histone H3. (B) Cl-amidine treatment inhibits NET formation. NZM neutrophils were treated with PMA in the presence or absence of Cl-amidine for 12 hours. NET formation was determined by fluorescence microscopy. (C) BALB/c neutrophils were incubated with either 2% BALB/c or NZM serum from mice older than 24 weeks for 12 hours in the presence or absence of Cl-amidine, as indicated in parentheses. (D) Cl-amidine treatment does not alter H2O2 production. NZM neutrophils were stimulated for 1 hour with PMA in the presence of inhibitors as indicated. The PMA-stimulated sample was arbitrarily set at 100% H2O2 production. DPI, NADPH oxidase inhibitor. (E) Cl-amidine treatment does not alter T cell activation. T cells were purified from NZM spleens and stimulated with anti-CD3/CD28 (black bars) in the presence or absence of Cl-amidine. CD25 expression was negligible (white bars) without stimulation. (F) Cl-amidine treatment does not alter lymphocyte proliferation. CFSE-labeled T or B cells were purified from NZM spleens and stimulated with anti-CD3/CD28 or LPS, respectively. After 48–72 hours, in the presence or absence of Cl-amidine, proliferating cells were quantified as described in Methods. For all experiments, data are shown as mean ± SEM, and at least 3 independent experiments are represented. *P < 0.05; ***P < 0.001.
Figure 4
Figure 4. In vivo, Cl-amidine inhibits NET formation while altering complement levels and the autoantibody profile of NZM mice.
Female NZM mice were treated by daily subcutaneous injection with either Cl-amidine (10 mg/kg/d) or vehicle control beginning at 12 weeks of age (10 mice per group). Mice were sacrificed at 26 weeks of age. (A) Bone marrow neutrophils from sacrificed mice were incubated either in the absence of serum for 4 hours (no stim) or with 100 nM PMA for 12 hours. NET formation was quantified by fluorescence microscopy. (BD) Serum from the aforementioned 2 groups was assayed for complement C3 (B), anti-dsDNA antibodies (C), or total IgG (D) using commercial kits. For C3, P values result from comparison to the baseline 12-week group. For anti-dsDNA, P values compare the vehicle and Cl-amidine groups directly. *P < 0.05; **P < 0.01; ***P < 0.001. For A, C, and D, data were plotted as the mean ± SEM. For B, boxes represent the median, 25th percentile, and 75th percentile, while whiskers delineate the minimum and maximum values.
Figure 5
Figure 5. PAD inhibition reduces MPO and immune complex deposition in the kidneys of NZM mice.
(A) Urine albumin/creatinine ratios were determined for the 2 groups of NZM mice presented in Figure 4. (B) 3-micron sections were prepared from formalin-fixed kidneys of 26-week-old mice, and activity index was calculated as described in Methods. (C) Glomerular MPO deposition was determined as described in Methods and in Supplemental Figure 2. Discrete areas of MPO staining were counted, with at least 10 glomeruli considered per mouse. (D) Glomeruli were also stained for IgG and C3 deposition. At least 10 glomeruli were scored for staining intensity on a scale of 0 to 3+, with average intensity then calculated for each kidney. *P < 0.05. One P value that approaches significance is presented as a number. Box-and-whisker plots represent 10 mice per group, with boxes representing the median, 25th percentile, and 75th percentile, while whiskers delineate the minimum and maximum values. (EH) Representative glomeruli from the vehicle group (E and G) and the Cl-amidine group (F and H). IgG is stained red and C3 is stained green. Original magnification, ×400. Scale bar: 25 microns.
Figure 6
Figure 6. PAD inhibition improves endothelial cell differentiation and endothelium-dependent vasorelaxation in NZM mice.
(A) For the 2 groups of mice presented in Figure 4, EPCs were identified as bone marrow cells capable of differentiating into mature endothelial cells (defined by coexpression of acetylated LDL and Lectin I as described in Methods). (B) Aortic rings were isolated from the same 2 groups of mice, and Ach-dependent relaxation was determined as described in Methods. Data are presented as the mean ± SEM for 10 mice per group. **P < 0.01; ***P < 0.001.
Figure 7
Figure 7. PAD inhibition prolongs time to arterial thrombosis and reduces NET density in NZM mice.
20-week-old NZM mice were treated with Cl-amidine (10 mg/kg/d) or vehicle, by daily subcutaneous injection for 1 week. Carotid artery thrombosis was then induced by photochemical injury, with DNase administered just prior to injury in some vehicle-treated mice. (A) Both DNase and Cl-amidine change the content of thrombi, resulting in the capture of fewer citrullinated histone H3–positive (H3-Cit) and CRAMP-positive structures. H&E and Hoechst 33342 (DNA in blue) staining are also shown for these representative paraffin-embedded sections. Arrowheads highlight NET-like structures. (B) For each thrombus, at least 3 sections were quantified for H3-Cit–positive (white bars) and CRAMP-positive (black bars) structures (n = 5 mice per group). (C and D) Both DNase and Cl-amidine prolong time to vessel occlusion (n = 10 for vehicle and Cl-amidine groups; n = 5 for the DNase group), with representative carotid artery flow tracings in D. (E) Cl-amidine reduces the NET density of carotid thrombi. Frozen sections were stained with Hoechst 33342 (DNA in blue) and anti-CRAMP (green). Representative images are shown, with overlays to the right. V, vessel wall; T, thrombus. (F) For each thrombus, at least 3 sections were quantified for discrete areas of DNA/CRAMP overlap (n = 5 per group). Original magnification, ×1000. Scale bars: 50 microns. Volumes were determined by multiplying thrombus area by section depth. All quantification is presented as mean ± SEM. *P < 0.05; **P < 0.01.

References

    1. Roman MJ, et al. Prevalence and correlates of accelerated atherosclerosis in systemic lupus erythematosus. N Engl J Med. 2003;349(25):2399–2406. doi: 10.1056/NEJMoa035471. - DOI - PubMed
    1. Urowitz MB, Bookman AA, Koehler BE, Gordon DA, Smythe HA, Ogryzlo MA. The bimodal mortality pattern of systemic lupus erythematosus. Am J Med. 1976;60(2):221–225. doi: 10.1016/0002-9343(76)90431-9. - DOI - PubMed
    1. Tsokos GC. Systemic lupus erythematosus. N Engl J Med. 2011;365(22):2110–2121. doi: 10.1056/NEJMra1100359. - DOI - PubMed
    1. Kaplan MJ, Salmon JE. How does interferon-alpha insult the vasculature? Let me count the ways. Arthritis Rheum. 2011;63(2):334–336. doi: 10.1002/art.30161. - DOI - PMC - PubMed
    1. Elkon KB, Stone VV. Type I interferon and systemic lupus erythematosus. J Interferon Cytokine Res. 2011;31(11):803–812. doi: 10.1089/jir.2011.0045. - DOI - PMC - PubMed

Publication types

MeSH terms