. 2013 Sep;24(9):1387-98.
doi: 10.1681/ASN.2012101041. Epub 2013 May 30.

Kindlin-2 mediates activation of TGF-β/Smad signaling and renal fibrosis

Affiliations

Kindlin-2 mediates activation of TGF-β/Smad signaling and renal fibrosis

Xiaofan Wei et al. J Am Soc Nephrol. 2013 Sep.

Abstract

Activation of TGF-β/Smad signaling plays a central role in the pathogenesis of tubulointerstitial fibrosis, but the mechanisms underlying the initial interaction of the TGF-β receptor with Smads, leading to their activation, remain unclear. Here, we found that Kindlin-2, an integrin-binding protein, physically mediated the interaction of the TGF-β type I receptor (TβRI) with Smad3 in human kidney tubular epithelial cells. Kindlin-2 bound to TβRI through its FERM domain and to Smad3 through its N terminus. Overexpression of Kindlin-2 increased TGF-β-induced Smad3 activation. Knockdown of Kindlin-2 significantly suppressed the engagement of TβRI with Smad3 and inhibited TGF-β-induced Smad3 activation, as well as the expression of its target genes. Neither transfection of a Kindlin-2 mutant incapable of binding to β1 integrin nor knockdown of β1 integrin influenced the effect of Kindlin-2 on TGF-β1-induced Smad3 activation, indicating that this effect is independent of integrin. Kindlin-2 expression was markedly increased, predominantly in renal tubular epithelial cells, both in the unilateral ureteral obstruction model of kidney fibrosis and in human tissue exhibiting tubulointerstitial fibrosis. Furthermore, in the unilateral ureteral obstruction model, knocking down Kindlin-2 significantly inhibited activation of TGF-β/Smad signaling, decreased the expression of matrix genes, and ameliorated fibrosis. In summary, Kindlin-2 physically interacts with both TβRI and Smad3, promoting the activation of TGF-β/Smad signaling and contributing to the pathogenesis of tubulointerstitial fibrosis. Blockade of Kindlin-2 might be a rational therapeutic strategy for the treatment of fibrotic kidney diseases.


Figures

Figure 1.
Figure 1.
Expression and localization of Kindlin-2 in HKCs. (A) Cell lysates (20 μg proteins/lane) of HKCs (lane 1) and HCT-116 (lane 2) are analyzed by Western blot with antibody recognizing Kindlin-2. Equal loading is confirmed by probing the membrane with anti-β-actin antibody. (B) Lysates (20 μg protein per lane) of HKCs (lane 1) and HaCaT cell lysates (lane 2) are analyzed by Western blot with antibody recognizing Kindlin-1. β-actin is used to verify equivalent loading. (C–E) HKCs are dually stained with mouse anti-Kindlin-2 mAb (C) and FITC-conjugated phalloidin (D). The image is merged in panel E. Scale bars, 10 μm.
Figure 2.
Figure 2.
TGF-β1 upregulates Kindlin-2 expression in HKCs. HKCs are treated with indicated concentrations of TGF-β1 for 48 hours (A and C), or 5 ng/ml of TGF-β1 for the indicated time period (B and D). Expression of Kindlin-2 is determined by quantitative RT-PCR (A and B) and Western blot (C and D). β-actin is used to verify equivalent loading. Values are mean ± SD of three independent experiments. *P<0.05 versus control.
Figure 3.
Figure 3.
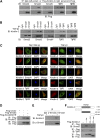
Kindlin-2 effectively interacts with Smad3 and TβRI. (A) HKCs are transfected with Flag-tagged-Kindlin-2 expression vector. Forty-eight hours after transfection, cell lysates are immunoprecipitated with anti-Flag antibody or normal IgG followed by immunoblotting using indicated antibodies. (B) HKCs are treated with or without TGF-β1 (5 ng/ml) for 30 minutes and then cell lysates are immunoprecipitated with indicated antibodies followed by immunoblotting using anti-Kindlin-2 mAb. (C) HKCs are transfected with pFlag-Smad2, pFlag-Smad3, pFlag-Smad4, pHA-TβRI, or pHA-TβRII. Forty-eight hours after transfection, cells were treated with or without TGF-β1 (5 ng/ml) for 30 minutes. Expression of Kindlin-2, Smad2, Smad3, Smad4, TβRI, and TβRII is analyzed by immunofluorescence staining. Nuclei are visualized with DAPI. (D) HKCs are transfected with wild-type Smad3, Smad3 mutant Smad3D407E, or empty vector. Cell lysates are immunoprecipitated with anti-Flag antibody followed by immunoblotting using anti-Kindlin-2 mAb. (E) HKCs are treated with or without TGF-β1 (5 ng/ml) for 30 minutes. Cell lysates are immunoprecipitated using anti-p-Smad3 antibody followed by immunoblotting using anti-Kindlin-2 mAb. (F) HKCs are transfected with the indicated pFlag-Kindlin-2 (amino acids 1–239, amino acids 240–569, or amino acids 570–680). Cell lysates are immunoprecipitated with anti-Flag antibody followed by immunoblotting using anti-Smad3 or TβRI antibody. DAPI, 4',6-diamidino-2-phenylindole. Scale bar, 10 μm in C.
Figure 4.
Figure 4.
Kindlin-2 is required for TGF-β1–induced interaction of TβRI with Smad3. (A) HKCs are treated with TGF-β1 (5ng/ml) for 30 minutes and then the endogenous interaction among Kindlin-2, Smad3, and TβRI is analyzed by coimmunoprecipitation. (B) pHA-TβRI, pFlag-Smad3, control siRNA, or Kindlin-2–specific siRNA is cotransfected in HKCs followed by TGF-β1 (5 ng/ml) treatment for 30 minutes. The interaction of TβRI with Smad3 is analyzed by coimmunoprecipitation. *P<0.05 versus control siRNA. (C) HKCs are treated with control siRNA or Kindlin-2 siRNA followed by TGF-β1 treatment for 30 minutes. Coimmunoprecipitation is performed to analyze the endogenous interaction between TβRI and Smad3. *P<0.05 versus control siRNA without TGF-β1 group; #P<0.05 versus control siRNA with TGF-β1 group. (D) HKCs are transfected with empty vector or pFlag-Kindlin-2 followed by TGF-β1 (5 ng/ml) treatment for 30 minutes. Coimmunoprecipitation is performed to analyze the endogenous interaction between TβRI and Smad3. *P<0.05 versus empty vector with TGF-β1 group.
Figure 5.
Figure 5.
Kindlin-2 is required for TGF-β1–induced Smad3 activation. (A and B) HKCs are transfected with empty vector or pFlag-Kindlin-2 followed by TGF-β1 (5 ng/ml) treatment for 30 minutes. P-Smad3 expression in cytosol (A) or in the nuclei (B) was examined by Western blot. Data are expressed as the mean ± SD of three independent experiments, *P<0.05 versus empty vector. (C and D) HKCs are transfected with control siRNA or Kindlin-2 siRNA followed by TGF-β1 (5 ng/ml) treatment for 30 minutes. P-Smad3 expression in cytosol (C) or in the nuclei (D) is examined by Western blot. *P<0.05 versus control siRNA group. (E) HKCs are cotransfected with Kindlin-2 siRNA and Kindlin-2 siRNA-resistant plasmid followed by TGF-β1 (5 ng/ml) treatment for 30 minutes. The expression of p-Smad3 and Kindlin-2 is analyzed by Western blot. *P<0.05 versus Kindlin-2 siRNA with empty vector group.
Figure 6.
Figure 6.
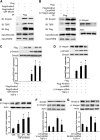
The role of Kindlin-2 in TGF-β/Smad signaling is independent of β1 integrin. (A) A Flag–Kindlin-2 QW mutant deficient in binding to β1 integrin is generated. Flag, Flag–Kindlin-2 WT, or QW mutant is transfected into HKCs. Cell lysates are immunoprecipitated with anti-Flag antibody by immunoblotting using indicated antibodies. (B) HKCs are cotransfected with indicated siRNA and Flag–Kindlin-2, cell lysates are immunoprecipitated with anti-Flag antibody by immunoblotting using indicated antibodies. (C) Flag, Flag–Kindlin-2 WT, or QW mutant is transfected into HKCs followed by TGF-β1 (5 ng/ml) treatment for 30 minutes. P-Smad3 expression is examined by Western blot. *P<0.05 versus Flag with TGF-β1 group. (D) HKCs are cotransfected with indicated siRNA and Flag–Kindlin-2 followed by TGF-β1 (5 ng/ml) treatment for 30 minutes. The expression of p-Smad3 is analyzed by Western blot. *P<0.05 versus Flag with TGF-β1 group. (E) HKCs are treated with 5 ng/ml of TGF-β1 for the indicated time period. β1 integrin expression is determined by Western blot. *P<0.05 versus control. (F and G) HKCs are transfected with control siRNA, Smad3 siRNA, or Kindlin-2 siRNA followed by TGF-β1 (5 ng/ml) treatment for 24 hours. The expression of β1 integrin is determined by Western blot. * P<0.05 versus control siRNA with TGF-β1 group.
Figure 7.
Figure 7.
Knockdown of Kindlin-2 inhibits the expression of TGF-β1–induced downstream target genes in HKCs. (A) Western blot analysis of Kindlin-2 expression in HKCs transfected with either control siRNA or Kindlin-2 siRNA. (B and C) HKCs are transfected with control siRNA or Kindlin-2 siRNA followed by TGF-β1 (5n g/ml) treatment for 48 hours. The expression of Col I, α-SMA, and Snail was determined by quantitative RT-PCR (B) or Western blot (C). *P<0.05 versus control siRNA without TGF-β1 group; #P<0.05 versus control siRNA with TGF-β1 group.
Figure 8.
Figure 8.
Depletion of Kindlin-2 ameliorates renal tubulointerstitial fibrosis. (A) Western blot analysis of Kindlin-2 expression in mice injected with control siRNA or Kindlin-2 siRNA (twice a week). *P<0.05 versus control siRNA (B) Representative micrographs demonstrate kidney injury at 7 days after UUO in different groups as indicated. Kidney sections are subjected to Masson trichrome staining. *P<0.05 versus sham; #P<0.05 versus UUO with control siRNA (n=5 for each group). (C) Representative micrographs show the abundance and distribution of Kindlin-2, p-Smad3, and TGF-β1 in the kidney of different groups of mice as indicated 7 days after UUO, respectively. (D–H) The expression of Kindlin-2, α-SMA, FN, Col I, Snail, β1 integrin, TGF-β1, or p-Smad3 in the kidney of different groups of mice 7 days after UUO is determined by quantitative RT-PCR (D and E) or Western blot (F–H). *P<0.05 versus sham; #P<0.05 versus UUO with control siRNA (n=5 for each group). GAPDH, glyceraldehyde 3-phosphate dehydrogenase. Scale bar, 50 μm in B and C.
Figure 9.
Figure 9.
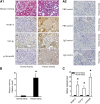
Increased expression of Kindlin-2 in human fibrotic kidney. (A1) Representative micrographs show the collagen deposition (blue) detected by Masson trichrome staining (a and b) and Kindlin-2 (c and d), TGF-β1 (e and f), and p-Smad3 (g and h) expression detected by immunohistochemical staining in human normal kidneys or fibrotic kidneys from patients with renal tubulointerstitial fibrosis. (A2) Control studies using nonimmuno-IgG or PBS instead of primary antibody (anti-Kindlin-2) showed negative staining. (B) Relative amount of collagen deposition in human normal kidneys (n=3) and human fibrotic kidneys (n=8). (C) Relative expression of Kindlin-2, TGF-β1, and p-Smad3 in human normal kidneys (n=3) and human fibrotic kidneys (n=8). *P<0.05 versus normal kidney. Scale bar in A1, 50 μm.

Comment in

  • Kindlin-2: a new player in renal fibrogenesis.
    Hirschberg R. Hirschberg R. J Am Soc Nephrol. 2013 Sep;24(9):1339-40. doi: 10.1681/ASN.2013060627. Epub 2013 Jul 11. J Am Soc Nephrol. 2013. PMID: 23847279 Free PMC article. No abstract available.

References

    1. Zeisberg M, Neilson EG: Mechanisms of tubulointerstitial fibrosis. J Am Soc Nephrol 21: 1819–1834, 2010 - PubMed
    1. Nangaku M: Mechanisms of tubulointerstitial injury in the kidney: Final common pathways to end-stage renal failure. Intern Med 43: 9–17, 2004 - PubMed
    1. Liu Y: Cellular and molecular mechanisms of renal fibrosis Nat Rev Nephrol 7: 684–696, 2011 - PMC - PubMed
    1. Boor P, Ostendorf T, Floege J: Renal fibrosis: Novel insights into mechanisms and therapeutic targets. Nat Rev Nephrol 6: 643–656, 2010 - PubMed
    1. Okada H, Kalluri R: Cellular and molecular pathways that lead to progression and regression of renal fibrogenesis. Curr Mol Med 5: 467–474, 2005 - PubMed

Publication types

MeSH terms

LinkOut - more resources