. 2013 May 27;8(5):e63457.
doi: 10.1371/journal.pone.0063457. Print 2013.

Spatial distribution of prominin-1 (CD133)-positive cells within germinative zones of the vertebrate brain

Affiliations

Spatial distribution of prominin-1 (CD133)-positive cells within germinative zones of the vertebrate brain

József Jászai et al. PLoS One. .

Abstract

Background: In mammals, embryonic neural progenitors as well as adult neural stem cells can be prospectively isolated based on the cell surface expression of prominin-1 (CD133), a plasma membrane glycoprotein. In contrast, characterization of neural progenitors in non-mammalian vertebrates endowed with significant constitutive neurogenesis and inherent self-repair ability is hampered by the lack of suitable cell surface markers. Here, we have investigated whether prominin-1-orthologues of the major non-mammalian vertebrate model organisms show any degree of conservation as for their association with neurogenic geminative zones within the central nervous system (CNS) as they do in mammals or associated with activated neural progenitors during provoked neurogenesis in the regenerating CNS.

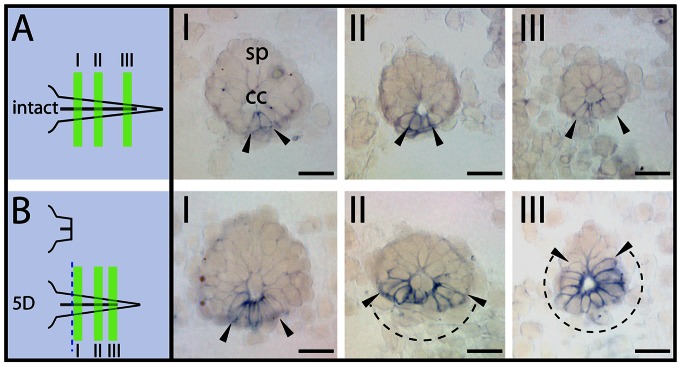
Methods: We have recently identified prominin-1 orthologues from zebrafish, axolotl and chicken. The spatial distribution of prominin-1-positive cells--in comparison to those of mice--was mapped in the intact brain in these organisms by non-radioactive in situ hybridization combined with detection of proliferating neural progenitors, marked either by proliferating cell nuclear antigen or 5-bromo-deoxyuridine. Furthermore, distribution of prominin-1 transcripts was investigated in the regenerating spinal cord of injured axolotl.

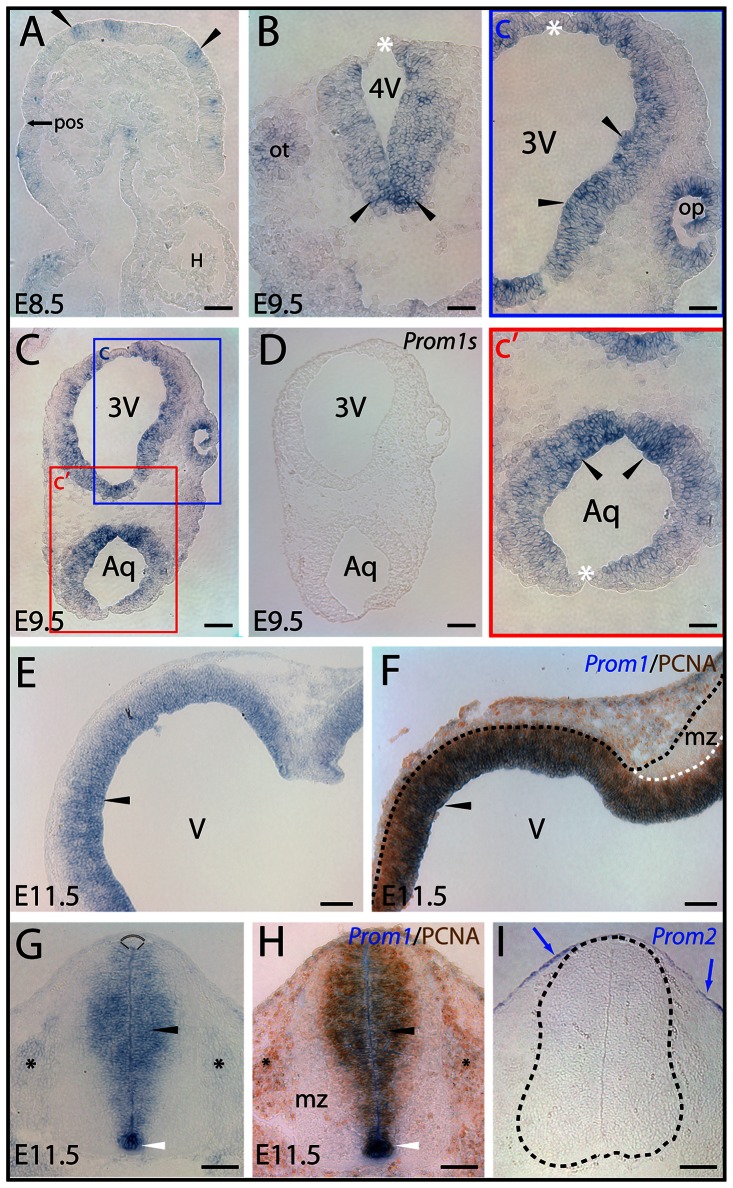
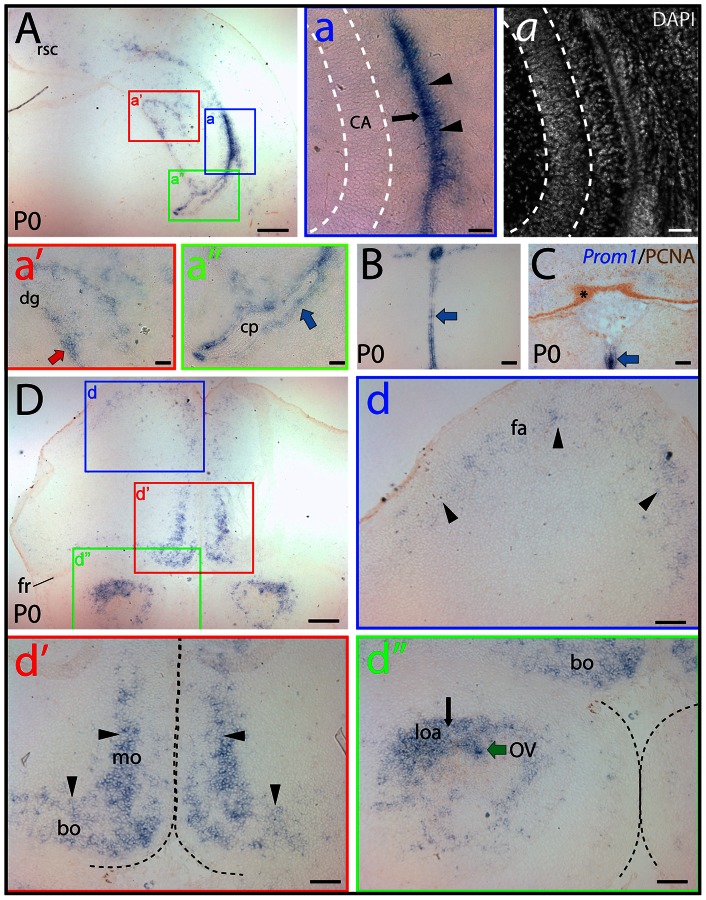
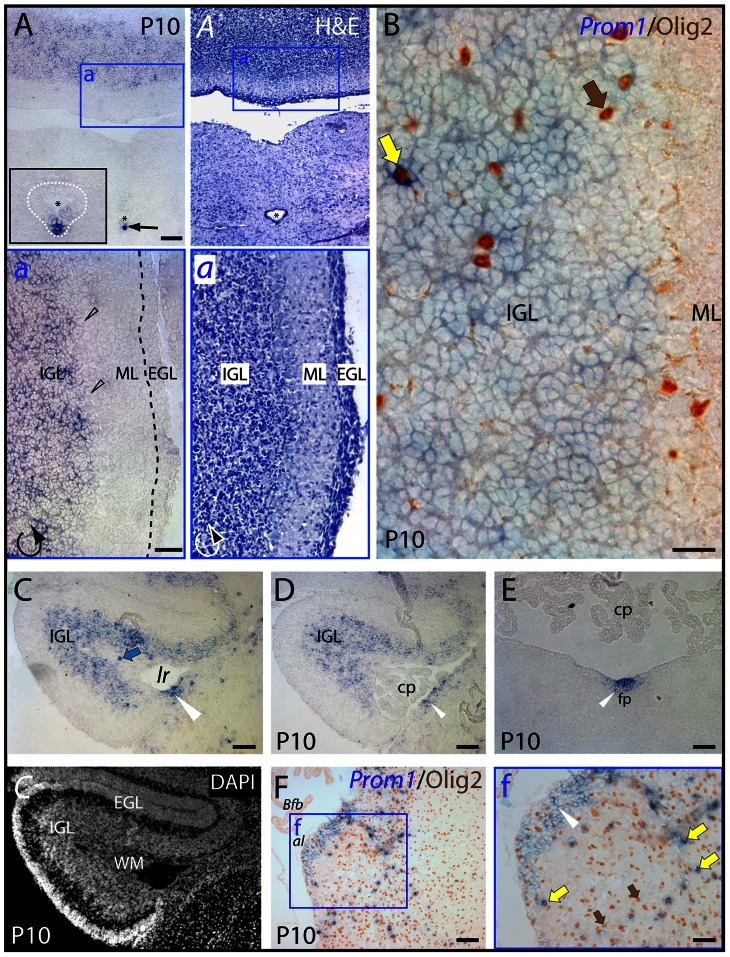
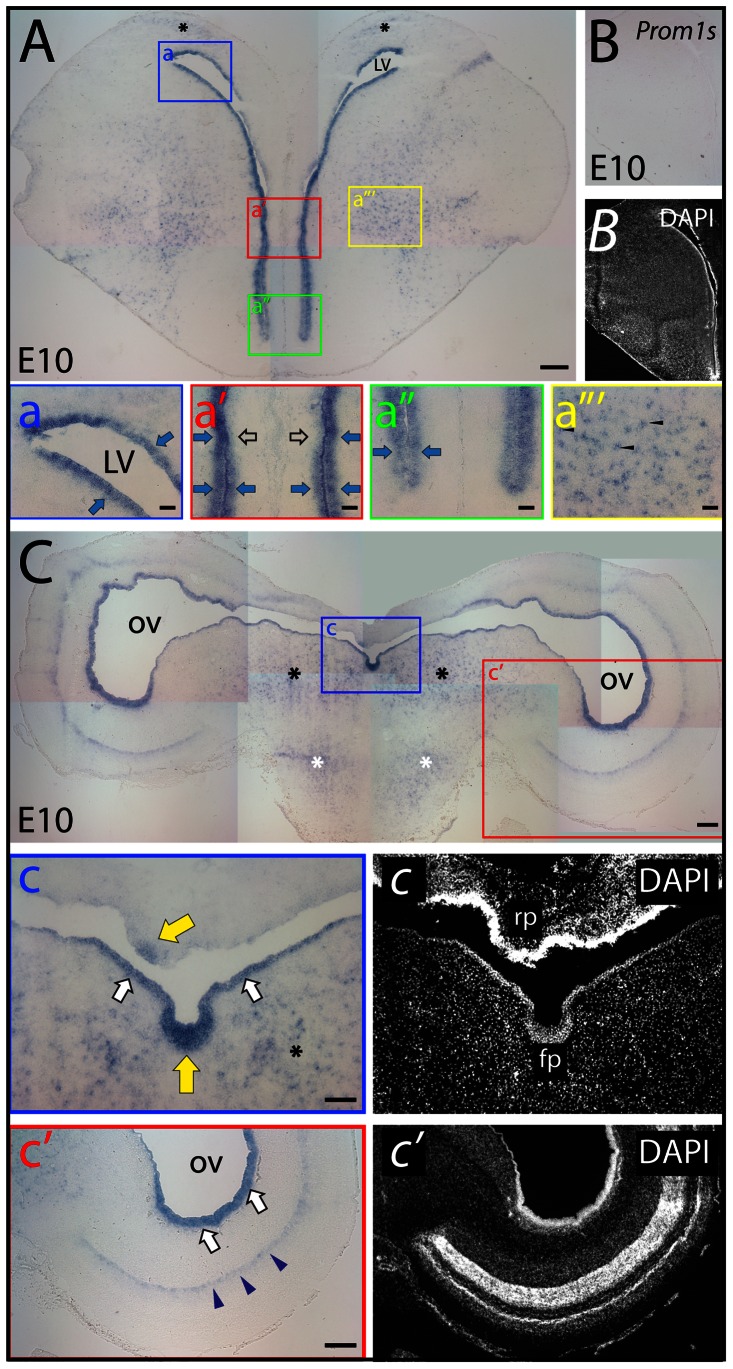
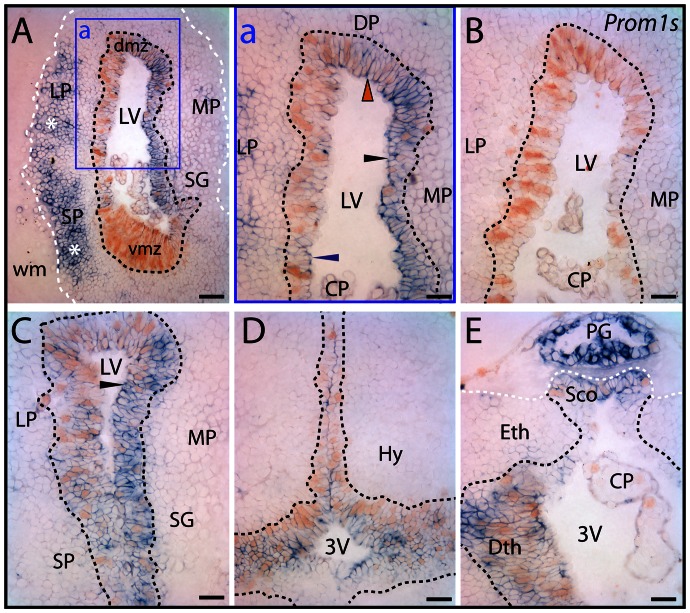
Results: Remarkably, a conserved association of prominin-1 with germinative zones of the CNS was uncovered as manifested in a significant co-localization with cell proliferation markers during normal constitutive neurogenesis in all species investigated. Moreover, an enhanced expression of prominin-1 became evident associated with provoked, compensatory neurogenesis during the epimorphic regeneration of the axolotl spinal cord. Interestingly, significant prominin-1-expressing cell populations were also detected at distinct extraventricular (parenchymal) locations in the CNS of all vertebrate species being suggestive of further, non-neurogenic neural function(s).

Conclusion/interpretation: Collectively, our work provides the first data set describing a comparative analysis of prominin-1-positive progenitor cells across species establishing a framework for further functional characterization in the context of regeneration.


Conflict of interest statement

Competing Interests: The authors have declared that no competing interests exist.

Figures

Figure 1
Figure 1. Distribution of murine prominin-1–positive cells in neural plate and developing neural tube.
(A–I) Cryosections of mouse embryos at early stages of development as indicated (E8.5, E9.5 and E11.5) were processed for ISH using either antisense (A–C, E, G) or sense (D; Prom1s) DIG-labeled prominin-1 probe alone or combined with immuno-detection of PCNA (F, H; Prom1/PCNA). Prominin-2 was detected with an antisense probe (I; Prom2). The boxed areas in C are shown at higher magnification in panels c and c'. Black arrowheads indicate prominin-1–positive neuroepithelial cells (blue) found as clusters in the anterior neural plate before neurulation (A) or thereafter along the neural tube within the hindbrain (B) and mesencephalic vesicle (C, c'), the prospective diencephalic part of the prosencephalon (C, c), and at later stage in the telencephalic vesicle (E), the mesencephalic-hindbrain junction (F) and ventricular zone of the spinal neural tube (G) where overlapping signals with PCNA (brown) are observed (F, H). Prominin-1–positive cells are also detected in otic (B; ot) and optic (c; op) vesicles, and prospective dorsal root ganglia (G, H; black asterisks). Note the intensity of prominin-1 expression within the neural tube is decreasing from the ventral midline floor (B, C, G, H; arrowheads) towards the dorsal roof plate (B, C, G; white asterisks, arc). The mantle zone (mz) is negative for prominin-1 and PCNA (F, H). Black and white dashed lines delineate the neural tube and its mz (F, I). Blue arrows indicate prominin-2–positive cells at the surface ectoderm whereas neural tube is negative (I). Orientation: A, parasagittal section – anterior to the right; E, coronal section – dorsal at the top; F, horizontal section – caudal to the right. 3V, prospective 3rd ventricle; 4V, prospective 4th ventricle; Aq, prospective aqueductus cerebri; H, heart tube; pos, pre-otic sulcus; V, prospective lateral ventricle. Scale bars, A, B, c, c', 50 µm; C–I, 100 µm.
Figure 2
Figure 2. Distribution of prominin-1–positive cells in the brain of newborn mouse.
(A–D) Cryosections of brains from postnatal day 0 (P0) animals were processed for ISH using an antisense DIG-labeled prominin-1 probe (A, B, D) alone or combined with immuno-detection of PCNA (C; Prom1/PCNA). The nuclear architecture was revealed using DAPI (a). The boxed areas in A and D are shown at higher magnification in the respective panels (a–a”, d–d”). (A, B, C) Cross-sections of telencephalic hemisphere at level of the commissura posterior (A), diencephalon (B) and hindbrain (C) reveal the restricted expression pattern of prominin-1–positive cells (blue) at the hippocampal and neopallial germinative sides of the lateral ventricle (a; black arrow and arrowheads, respectively), in the developing dentate gyrus (a'; dg, red arrow), the ependymal layers (blue arrows) lining the lateral (a”) and 3rd ventricle (B) as well as the midline floor of the 4th ventricle (C). Choroid plexus epithelium (a”; cp) and the germinative layer of the cerebellum marked by PCNA (C; brown, asterisk) are negative. (D) Rostral cross-section of the telencephalon near to the frontal pole reveals that prominin-1–positive cells form an irregular stripe extending from the dorso-lateral through the medial to the basal (orbital) sides, where the labeling intensity is increasing toward the basal domain (compare panels d and d'; arrowheads). Black and green arrows indicate prominin-1–positive cells in the lateral olfactory area (loa) and in the ependymal wall of the olfactory ventricle (OV), respectively (d”). White dashed lines delineate the pyramidal layer of the hippocampus (a) whereas the black ones separate the two hemispheres (d') and olfactory bulbs (d”). Bo, basal orbito-frontal cortex; CA, Cornu Ammonis; fa, frontal association cortex; fr, Fissura rhinalis; mo, medial orbito-frontal cortex; rsc, retrosplenial cortex. Scale bars, A, D, 250 µm; a, a, 50 µm; a', a”, B, C, d–d”, 100 µm.
Figure 3
Figure 3. Distribution of murine prominin-1–positive cells in the cerebellum and hindbrain.
(A–F) Cryosections of brains from postnatal day 10 (P10) animals were processed for ISH using an antisense DIG-labeled prominin-1 probe (A, C–E) alone or combined with immuno-detection of Olig2 (B, F; Prom1/Olig2). The cytoarchitecture was revealed using haematoxylin-eosin (H&E) straining (A, a) or DAPI (C). The boxed areas in A, A and F are shown at higher magnification in the respective panels a, a and f. (A, B) Cross-sections through the caudal medulla oblongata and cerebellum show prominin-1–positive cells (blue) in the cerebellar inner granule layer (IGL) and their absence from the molecular (ML) and external granule layers (EGL; both delineated by black dashed line in sub-panel a). Note a strong prominin-1 expression (black arrow) in ependymal cells (white dashed line) lining the ventral midline of the central canal (asterisk, see inset in panel A). (CF) Cross-sections of the rostral medulla oblongata through the lateral recess (lr) (C, D) and midline floor of the fossa rhomboidea (E) at the level of the cerebellar flocculus (C–E) or at the cochlear area/lateral aperture (F) reveal prominin-1–positive cells in both subependymal and ependymal locations (white arrowheads) underlying the lateral recess or in the floor plate (fp). Prominin-1 is also detected in the cerebellar white matter (C, C; WM, blue arrow), and scattered prominin-1–positive cells expressing Olig2 (brown; yellow arrows) are observed within the cerebellum (B) and hindbrain parenchyma (f). Purkinje-cells (black hollow arrowheads), choroid plexus (cp) and its Bochdalek's flower basket (Bfb) are negative. Olig2–positive/prominin-1–negative cells are indicated with brown arrows. al, apertura lateralis Luschkae. Scale bars, A, a, C–F, 100 µm; B, 25 µm; f, 50 µm.
Figure 4
Figure 4. Distribution of prominin-1–positive cells in telencephalon and mesencephalon of embryonic chick.
(A–C) Cryosections of brains from chick embryos at day 10 (E10) were processed for ISH using either an antisense (A, C) or sense (B; Prom1s) DIG-labeled prominin-1 probe. The nuclear architecture was revealed using DAPI (B, C, C'). The boxed areas in A and C are shown at higher magnification in the respective panels a–a'” and c–c'. Coronal cross-sections from the rostral telencephalon (A) reveal prominin-1–positive cells (blue) all along the ventricular zone (A, a–a”; blue arrows). Note the reduced level of prominin-1 expression at the transition of the ventral germinative zone and medial septal ventricular wall (A, a'; black hollow arrows). Cross-section profiles of the mesencephalon (C) reveal prominin-1–positive cells along the ventricular zone lining the tegmentum (c) and tectum (c') (white arrows), being especially enriched in the midline floor (mf, yellow arrow) and less intensive in the roof plate (rp, yellow arrow). A thin sub-layer of cells in developing optic tectum is positive (blue arrowheads). Scattered parenchymal prominin-1–positive cells are detected both in the pallium (A; asterisks) and subpallium (a”'; arrowheads) as well as in the mesencephalic and pontine tegmentum (C, c; black and white asterisks, respectively). LV, lateral ventricle; OV, optic ventricle. Scale bars, A, C, c', 250 µm; a–a'”, 50 µm; c, 100 µm.
Figure 5
Figure 5. Distribution of prominin-1–positive cells in telencephalon, optic tectum and cerebellum of embryonic chick.
(A–D) Cryosections of brains from chick embryos at day 15 (E15) and 20 (E20) were processed for ISH using an antisense DIG-labeled prominin-1 probe alone (A–D) or combined with immuno-detection of PCNA (a'; PCNA). The nuclear architecture was revealed using DAPI (a, B, C, d). The boxed areas in A, B and D are shown at higher magnification in panels a, b and d, respectively. (A, B) Coronal sections of the rostral telencephalon (A) and a hemisphere of the mesencephalic optic tectum (B) reveal prominin-1–positive cells (blue arrows) along the telencephalic and tectal ventricular zone (VZ), respectively, where proliferating cells are detected (a'; white arrowheads, PCNA). Parenchymal (extraventricular) prominin-1–positive cell populations are found both in the telencephalic pallium and subpallium (A; black asterisks, a; black arrowhead) as well as in all sublayers of the tectum being especially enriched in the stratum griseum centrale (SGC) and lamina i of the stratum griseum et fibrosum superficiale (SGFS) (B, b; optic tectum layers are indicated by dashed lines). (C, D) Sections through cerebellar folia reveal the presence of prominin-1–positive cells in the cerebellar inner granule layer (IGL) and Purkinje cells (Pc) and their absence from the molecular layer (ML) and the subpial external granule layer (EGL, white and yellow dashed lines). Tectal sublayers were identified by the nuclear architecture according to the literature , White matter (wm) in the centre of a cerebellar folium is indicated with dashed lines. LV, lateral ventricle; OV, optic ventricle; SAC, stratum album centrale; SVZ, subventricular zone. Scale bars, A, B, 250 µm; a, d, 25 µm; b, C, 100 µm; D, 50 µm.
Figure 6
Figure 6. The combined expression of prominin-1a and b mimics the distribution of musashi-1 in adult zebrafish brain.
(A–C) Cryosections of 3-month-old adult brain from BrdU-treated zebrafish were processed for ISH using an antisense DIG-labeled probe either against prominin-1a (A; prom1a), prominin-1b (B; prom1b) or musashi-1 (C; msi1). Proliferating cells were observed by immuno-detection of BrdU (brown). Proliferative zones are indicated with Arabic numbers (1 to 16, see below) from rostral to caudal direction along the neuraxis as proposed , and position of parasagittal section profiles of the brain is indicated on the cartoon (A) adapted from a standard neuroanatomical atlas of the zebrafish brain by Wulliman and colleagues . The boxed areas in A–C are shown at higher magnification in Figure S2. Black dashed line indicates the border of prosencephalon towards the tegmentum of the brainstem (A). Coloured arrows and asterisks indicate overlapping expression domains of particular genes. Note that major sites of expression of prominin-1a are mainly located in the prosencephalic (rostral) and dorsal mesencephalic (tectal) domain (A), whereas prominin-1b is predominantly found in the rhombencephalic brainstem (caudal) domain (B). Msi1-1–positive cells are confined to all known proliferative zones both in rostral and caudal brain regions (C). CC, crista cerebellaris; CM, corpus mamillare; Cpost, commissura posterior; DIL, diffuse nucleus of the hypothalamic inferior lobe; Rh, rhombencephalon; SD, saccus dorsalis; T, telencephalon; 4V, fourth ventricle. Proliferative zones are: 1, olfactory bulb (OB); 2, ventral telencephalon; 3, dorsal telencephalon; 4, preoptic area; 5, ventral thalamus, 6, habenula; 7, periventricular zone of pretectum; 8, dorsal thalamus; 9, posterior tuberculum; 10, hypothalamus (Hy); 11, tectum opticum; 12, torus longitudinalis; 13, posterior mesencephalic lamina; 14a, molecular layer of valvula and corpus cerebelli (CCe); 14b, lobus caudalis cerebelli; 15, facial and vagal lobes; 16, ventricular zone of the fossa rhomboidea/canalis centralis. Zone 3 is indicated with a hollow number because is not represented on the present section. Black asterisk indicates rhombencephalic brain parenchyma. Scale bars, A–C, 250 µm.
Figure 7
Figure 7. Distribution of zebrafish prominin-1a– and b–positive cells in the dorsal lateral telencephalon and the tectal ventricular zone.
(A–C) Cryosections of 3-month-old adult brain from BrdU-treated zebrafish were processed for ISH using an antisense DIG-labeled probe either against prominin-1a (A; prom1a), prominin-1b (B; prom1b) or musashi-1 (C; msi1). Proliferating cells were observed by immuno-detection of BrdU (brown). Position of paramedian longitudinal sections of the brain is indicated on the cartoon (A) adapted from the neuroanatomical atlas by Wulliman and colleagues . The boxed areas in A, B and C are displayed at a higher magnification in panels a–a”, b–b” and c–c”, respectively. (A) Prominin-1a–positive cells are enriched in the diffuse nucleus of the hypothalamic inferior lobe (A, DIL) and in the extraventricular dorsal telencephalic parenchyma (a, black asterisk). They are found within the proliferative zone 3 (3) of the dorsal telencephalic surface (a, a', blue arrows), and are either BrdU–positive or negative (yellow and blue arrows, respectively, see inset in a). Rare proliferating cells are devoid of prominin-1a (a, brown arrow). Prominin-1a–positive cells are also detected in the superficial (blue arrows) and deeper (red arrow and green asterisk) areas of periventricular grey zone (PGZ) and Torus semicircularis (TSc) lining the optic (tectal) ventricle (OV) (a”), respectively. While the marginal proliferating zone of the tectum (MPZ) lacks prominin-1a, a small number of prominin-1a–positive proliferating cells is observed in the posterior mesencephalic lamina (PML) (a”, see inset, blue arrowhead). (B) Prominin-1b–positive cells (grey arrows) are found in the superficial tear of PGZ (b') and in TSc lining the OV (b”), whereas proliferating cells within the zone 3 of the dorsal telencephalic surface (b, brown arrows), the deeper areas of the PGZ (b') and in the MPZ (b”) are negative. (C) Msi-1–positive cells found within the proliferative zone 3 of the dorsal telencephalic surface (c, c') are either BrdU–positive or negative (yellow and green arrows, respectively). Rare proliferating cells are devoid of msi-1 (c, brown arrow). Msi-1 is detected in the superficial tear of PGZ and TSc lining the OV (c”) as well as in proliferating cells of the MPZ and those of the PML (c”, green arrowheads). CCe, corpus cerebelli; DI, dorsal lateral subdivision of the dorsal telencephalic region; TeO, tectum opticum. Scale bars, A–C, 250 µm; a–c”, 50 µm.
Figure 8
Figure 8. Differential expression of zebrafish prominin-1a– and b–positive cells in the posterior dorsal telencephalon.
(A–C) Cryosections of 3-month-old adult brain from BrdU-treated zebrafish were processed for ISH using an antisense DIG-labeled probe either against prominin-1a (A; prom1a), prominin-1b (B; prom1b) or musashi-1 (C; msi1). Proliferating cells were observed by immuno-detection of BrdU (brown). Position of the two coronal cross section profiles (I, II) encompassing the posterior dorsal telencephalic area is indicated on the cartoon adapted from a neuroanatomical atlas by Wulliman and colleagues , and the distribution of proliferative events (brown dots) is schematically shown. (A) Prominin-1a–positive cells are distributed along the posterior medial, dorsal and lateral aspects of the dorsal telencephalic surface proliferation zone (yellow arrows, see inset), and in the extraventricular brain parenchyma of the dorsal telencephalon (dT, asterisks) as well in the periventricular preoptic nucleus (PPa, blue arrows). (B) No prominin-1b–positive cells are detected within the dorsal telencephalic and preoptic proliferative zones (brown arrows). (C) Prosencephalic msi1–positive cells are found in a narrow ventricular stripe encompassing the proliferating subdivisions of the telencephalon, and that of the preoptic area and recessus opticus (Ro) of the diencephalic ventricle (green arrows). Proliferative zones 3 and 4 correspond to dorsal telencephalon and preoptic area, respectively. CO, chiasma opticum. Scale bars, A–C, 250 µm.
Figure 9
Figure 9. Distribution of prominin-1–positive cells in telencephalon and diencephalon of axolotl.
(A–E) Cryosections of the brain from 7.5-cm long juvenile axolotl were processed for ISH using either an antisense (A, C–E) or sense (B; Prom1s) DIG-labeled prominin-1 probe combined with immuno-detection of PCNA. The boxed area in A is displayed at a higher magnification in panel a. (A) Coronal section of telencephalic hemispheres rostral to the plane of interventricular foramina reveals an uneven distribution of prominin-1–positive cells (blue) within the proliferating ventricular germinative matrix defined by the PCNA (brown, black dashed lines) and in the surrounding periventricular grey matter. Strong prominin-1 expression is detected in the medial (MP) and dorsal (DP) pallial sector of the ventricular germinative zone (black and red arrowheads, respectively), whereas its expression is modest in the lateral pallial (LP) one (blue arrowhead) and minimal in the ventral matrix zone (vmz). In extraventricular areas, an enrichment of prominin-1 is observed in the LP and subpallial (SP) neuronal assemblies (asterisks) of stratum griseum (SG). Note the paucity of prominin-1 in the choroid plexus (CP) and its absence from white matter (wm, white dashed line). (B) No labeling was observed with sense probe. (C–F) Frontal sections through the caudal telencephalon (C) and those of the ventral (D) and dorsal (E) diencephalon at the level of the subcommissural organ (Sco) reveal prominin-1 expression in proliferating cells (black arrowheads) lining the lateral ventricule (LV) and 3rd ventricle (3V), respectively. A robust prominin-1 expression is detected in the pineal gland (E; PG). The boundary of the grey matter is delimitated with a white dashed line (E). Dmz, dorsal matrix zone; Dth, dorsal thalamus; Hy, hypothalamus; Eth, epithalamus. Scale bars, A, 100 µm; a', C–E, 50 µm.
Figure 10
Figure 10. Up-regulation of prominin-1 in regenerating spinal neural tube of axolotl.
(A, B) Cryosections of intact tail (A, intact) from 3.5-cm long larval axolotl and those of five-day post-amputation tail regenerate (B, 5D) were processed for ISH using an antisense DIG-labeled prominin-1 probe. The plane of amputation and the position section planes (I–III) along the rostro-caudal axis of the spinal neural tube (sp) are schematically displayed. Note that in the regenerating neural tube (B) an expansion of prominin-1 expression (blue, arrowheads) towards lateral and dorsal co-ordinates is observed in the caudal direction (II-III; dashed lines) in comparison to intact samples (A). cc, central canal. Scale bars, A, B, 50 µm.

References

    1. Doetsch F, Caillé I, Lim DA, García-Verdugo JM, Alvarez-Buylla A (1999) Subventricular zone astrocytes are neural stem cells in the adult mammalian brain. Cell 97: 703–16. - PubMed
    1. Alvarez-Buylla A, Seri B, Doetsch F (2002) Identification of neural stem cells in the adult vertebrate brain. Brain Res Bull 57: 751–58. - PubMed
    1. Götz M, Huttner WB (2005) The cell biology of neurogenesis. Nat Rev Mol Cell Biol 6: 777–88. - PubMed
    1. Kee N, Teixeira CM, Wang AH, Frankland PW (2007) Preferential incorporation of adult-generated granule cells into spatial memory networks in the dentate gyrus. Nat Neurosci 10: 355–62. - PubMed
    1. Imayoshi I, Sakamoto M, Ohtsuka T, Takao K, Miyakawa T, et al. (2008) Roles of continuous neurogenesis in the structural and functional integrity of the adult forebrain. Nat Neurosci 11: 1153–61. - PubMed

Publication types

MeSH terms