. 2013 May 28;8(5):e63638.
doi: 10.1371/journal.pone.0063638. Print 2013.

The role of paracrine and autocrine signaling in the early phase of adipogenic differentiation of adipose-derived stem cells

Affiliations

The role of paracrine and autocrine signaling in the early phase of adipogenic differentiation of adipose-derived stem cells

Mette Hemmingsen et al. PLoS One. .

Abstract

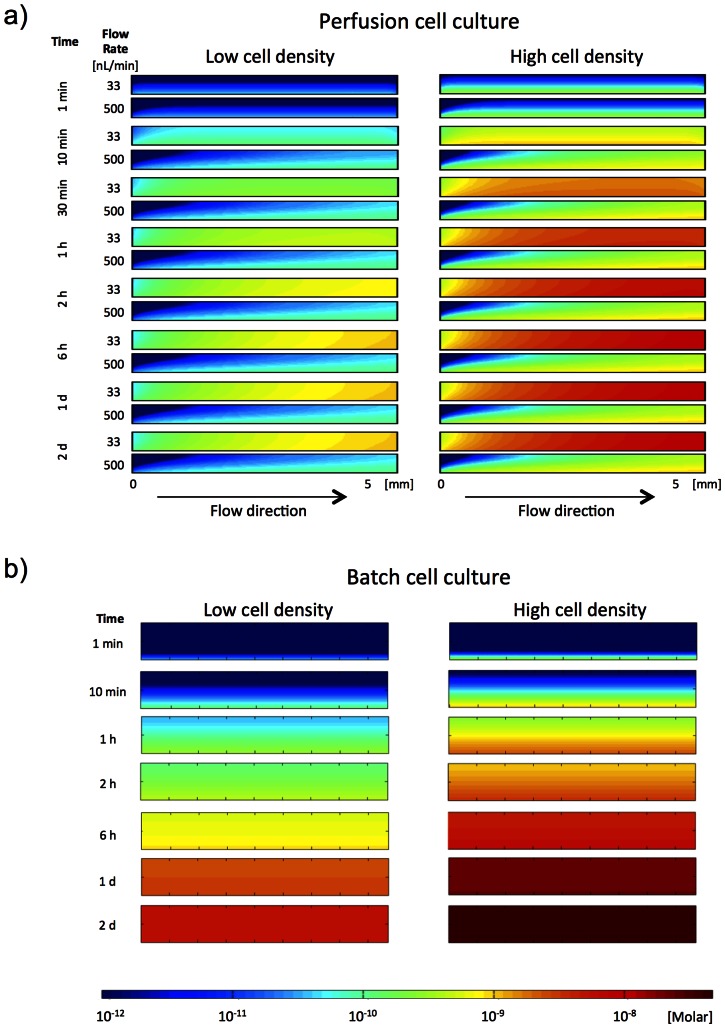
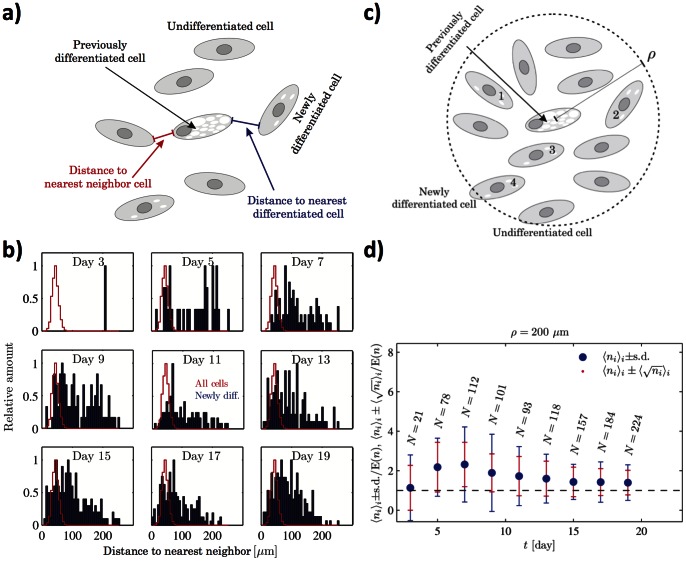
Introduction: High cell density is known to enhance adipogenic differentiation of mesenchymal stem cells, suggesting secretion of signaling factors or cell-contact-mediated signaling. By employing microfluidic biochip technology, we have been able to separate these two processes and study the secretion pathways.

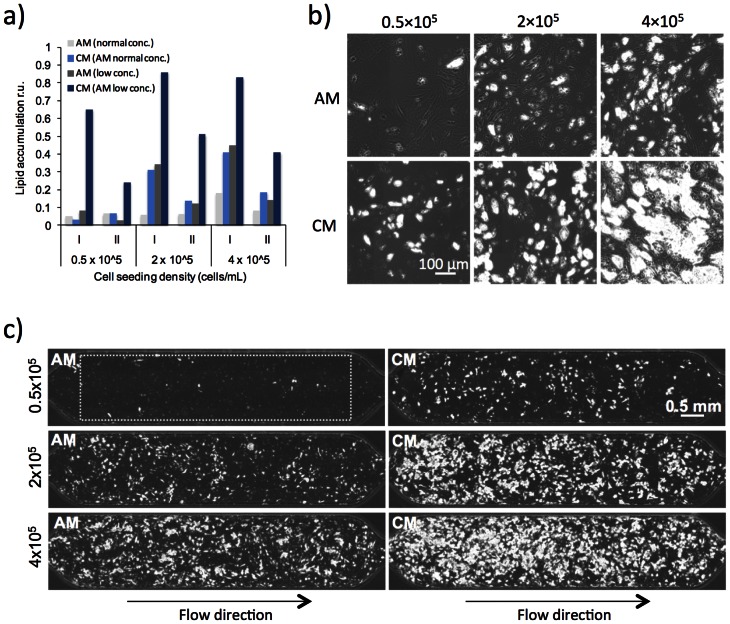
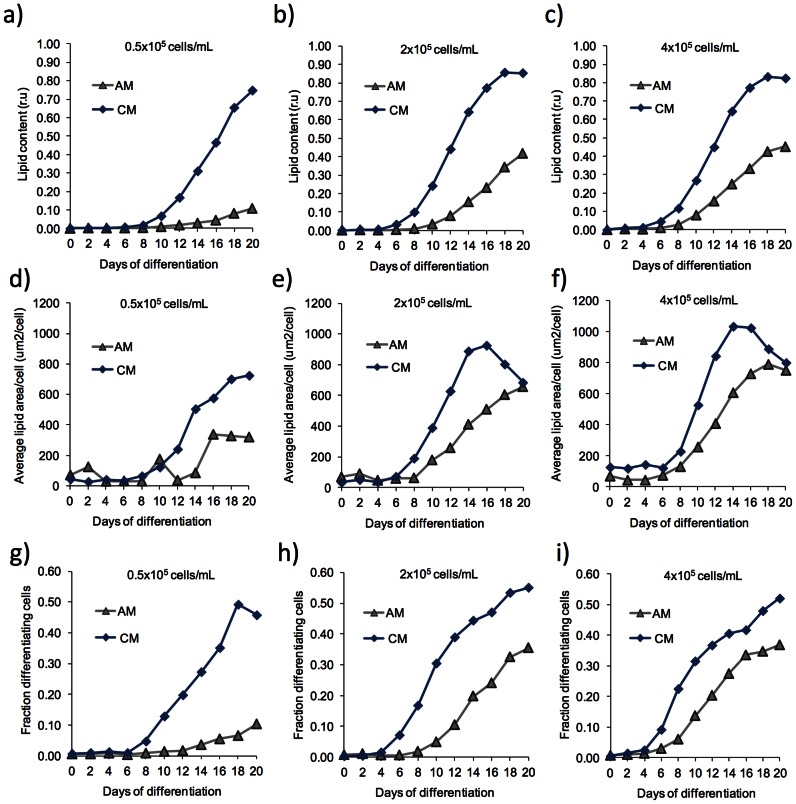
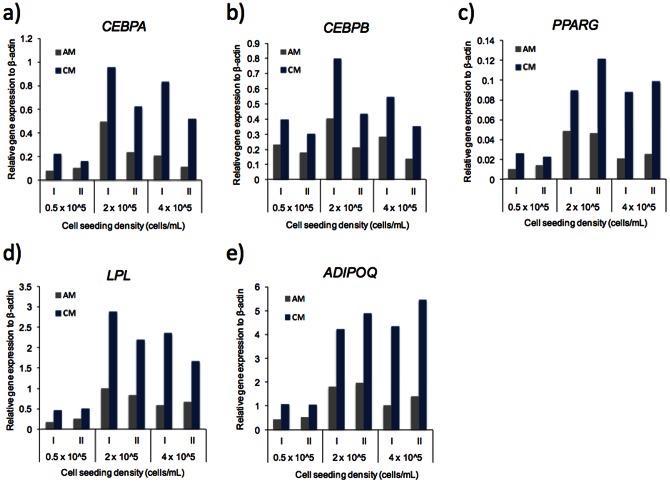
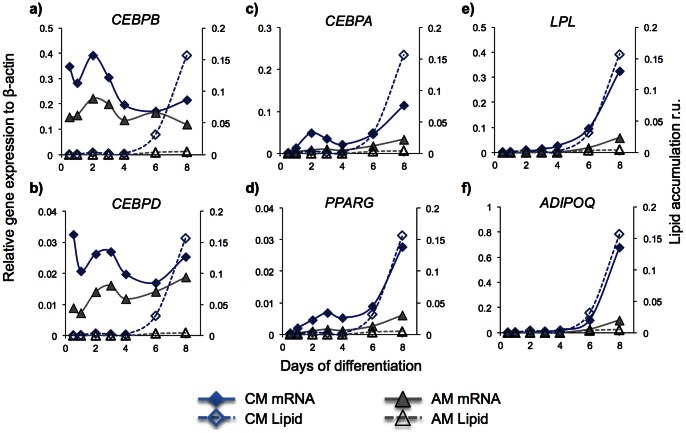
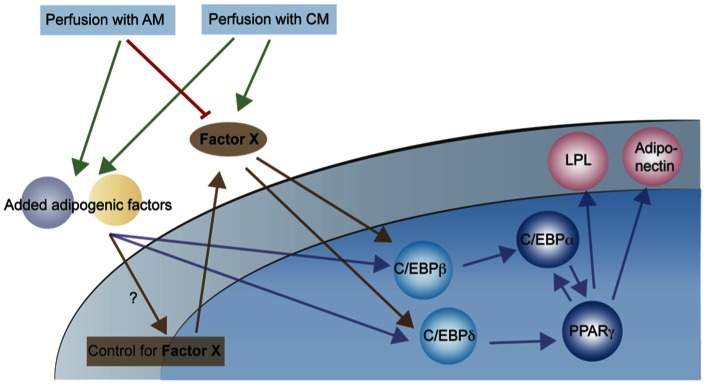
Methods and results: Adipogenic differentiation of human adipose-derived stem cells (ASCs) cultured in a microfluidic system was investigated under perfusion conditions with an adipogenic medium or an adipogenic medium supplemented with supernatant from differentiating ASCs (conditioned medium). Conditioned medium increased adipogenic differentiation compared to adipogenic medium with respect to accumulation of lipid-filled vacuoles and gene expression of key adipogenic markers (C/EBPα, C/EBPβ, C/EBPδ, PPARγ, LPL and adiponectin). The positive effects of conditioned medium were observed early in the differentiation process.

Conclusions: Using different cell densities and microfluidic perfusion cell cultures to suppress the effects of cell-released factors, we have demonstrated the significant role played by auto- or paracrine signaling in adipocyte differentiation. The cell-released factor(s) were shown to act in the recruitment phase of the differentiation process.


Conflict of interest statement

Competing Interests: The authors have declared that no competing interests exist.

Figures

Figure 1
Figure 1. Numerical simulations of secreted factor accumulation in the chambers.
Simulated distribution of a cell-released factor from cells residing at the bottom of A) a microfluidic chamber (h = 0.5 mm, l = 6 mm, w = 1.5 mm) perfused at 33nL/min or at 500 nL/min, and B) a conventional well (d = 17 mm and a height of medium of 2 mm) at either low cell density (left) or high cell density (right). The high cell density condition corresponds to cells covering the entire surface, while the low cell density condition was set 8 times lower than the high cell density. The rate of secreted factor was set to 100 molecules per cell per second, which is one order of magnitude lower than estimated antibody production in hybridoma cells , . Simulation of released factor is shown from 1 second to 2 days. See Materials and Methods for more details about the analysis.
Figure 2
Figure 2. Effect of conditioned medium on adipogenic differentiation.
ASCs were loaded at different cell suspension densities, 0.5×10⁵, 2×10⁵ or 4×10⁵ cells/mL, and induced to differentiate at a flow rate of 500 nL/min in AM or CM at two different concentrations of serum and adipogenic factors. CM was a 1∶1 mixture of supernatant from ASCs undergoing differentiation in batch cultures and fresh AM to ensure sufficient supply of nutrients. 1.5×AM was used in the mixture instead of 1×AM to compensate for an expected consumption/degradation of the adipogenic stimuli in the collected supernatant. A) Relative lipid accumulation in relative units. Lipid accumulation in the chambers are taken as a measurement of extent of differentiation, and was determined by quantifying the total area of lipid-filled droplets in each chamber (within the rectangle indicated by the dotted line in figure 2c) divided by the corresponding total cell area at the start of differentiation, see also material and methods. I and II denote two independent experiments. AM (low conc.) and CM (AM low conc.) indicate AM with 4 times lower concentrations of serum and adipogenic inducers and CM based on the 4 times lower concentrated AM. B) 10x phase contrast images 14 days after differentiation initiation of a representative area of a chamber at the different tested conditions. C) Scan of an entire cell culture chamber. The rectangle indicated by the dotted line shows the area of a cell culture chamber used for measurements of extent of differentiation with respect to total lipid area, lipid vacuole area per cell and fraction of differentiated cells (Figure 3 and Figure S3).
Figure 3
Figure 3. Time course study of lipid accumulation during adipogenic differentiation.
Experiment I out of two independent experiments was followed over time. An image of cells in the entire cell culture chamber was captured every second day and relative lipid accumulation in relative units (A–C), lipid area per cell (D–F) and fraction of differentiated cells (G–I) was determined as described in material and methods. Each graph in the diagrams corresponds to analysis of one chamber. Corresponding results from experiment II are shown in Figure S3.
Figure 4
Figure 4. Quantitative measurements of gene expression of adipogenic markers.
ASCs were loaded at different cell suspension densities, 0.5×10⁵, 2×10⁵ or 4×10⁵ cells/mL, and induced to differentiate at a flow rate of 500 nL/min in AM or CM. A–E) Gene expression of the adipogenic markers CEBPA, CEBPB, PPARG, LPL, and ADIPOQ was determined by reverse transcription real time PCR and normalized to expression of ACTB, see material and methods. (I) denotes experiment I and (II) denotes experiment II of two independent experiments.
Figure 5
Figure 5. Effect of conditioned medium on gene expression of adipogenic markers early in the differentiation process.
In an additional set of experiments ASCs were loaded at a cell suspension density of 2×10⁵ cells/mL and induced to differentiate at a flow rate of 500 nL/min in AM or CM. Gene expression of the adipogenic markers CEBPB, CEBPD, CEBPA, PPARG, LPL and ADIPOQ was analyzed by reverse transcription real time PCR of all cells in one cell culture chamber after 12 hours, 1, 2, 3, 4, 6, and 8 days of differentiation. The results shown are from experiment I out of three independent experiments. Results from experiments II and III are shown in Figure S4 and S5. Relative gene expression to β-actin shown on the left y-axis for A) CEBPB, B) CEBPD, C) CEBPA, D) PPARG, E) LPL and F) ADIPOQ. The corresponding lipid accumulation is shown on the right y-axis. Note the y-axis scales denoting the real-time PCR results are different in order to clearly visualize effects of CM on all adipogenic markers. Each point on the graphs corresponds to analysis of cells from one chamber.
Figure 6
Figure 6. Source of factor secretion.
A) Schematic illustration of the analysis used to investigate the potential increased differentiation due to positional proximity to already differentiated cells. B) Distributions of the average distances between newly differentiated cells and the closest already differentiated cell (blue) compared to the average distance between all nearest neighbor cells (red) for data at the cell density 270 cells/mm2 exposed to AM at Q = 500 nL min−1. Each plot in each panel is normalized by its largest value. C) Schematic illustration of the second independent analysis used to for investigating number of differentiating cells within a certain radius ρ from a differentiated cell. D) Average number of newly differentiated cells exposed to AM within a radius of ρ  = 200 μm from each previously differentiated cell normalized by the amount E(n) expected from random placement of all newly differentiated cells in the whole chamber. N indicates the total number of newly differentiated cells detected in the present image. The blue error bars indicate the standard deviation of the number of newly differentiated cells within the radii of the previously differentiated cells, while the red error bars illustrate the average counting error due to finite statistics.
Figure 7
Figure 7. Graphical model of signaling in ASC adipogenic differentiation.
ASCs exposed to adipogenic stimuli in AM secrete an unknown factor acting as a positive regulating signal in the differentiation process. This positive cell-released signaling factor is removed during perfusion conditions with AM thereby suppressing differentiation. Differentiation can be restored by perfusion with the factor contained in CM. The auto/paracrine signaling factor is acting in the early phase of differentiation upstream of the transcription factors C/EBPβ and C/EBPδ.

References

    1. Cristancho AG, Lazar MA (2011) Forming functional fat: a growing understanding of adipocyte differentiation. Nature Reviews Molecular Cell Biology 12: 722–734. - PMC - PubMed
    1. Koppen A, Kalkhoven E (2010) Brown vs white adipocytes: The PPAR gamma coregulator story. Febs Letters 584: 3250–3259. - PubMed
    1. Rosen ED, MacDougald OA (2006) Adipocyte differentiation from the inside out. Nature Reviews Molecular Cell Biology 7: 885–896. - PubMed
    1. Zuk PA, Zhu M, Ashjian P, De Ugarte DA, Huang JI, et al. (2002) Human adipose tissue is a source of multipotent stem cells. Molecular Biology of the Cell 13: 4279–4295. - PMC - PubMed
    1. Mizuno H, Tobita M, Uysal AC (2012) Concise Review: Adipose-Derived Stem Cells as a Novel Tool for Future Regenerative Medicine. Stem Cells 30: 804–810. - PubMed

Publication types