. 2013 May 28;8(5):e64673.
doi: 10.1371/journal.pone.0064673. Print 2013.

Separate populations of neurons in ventral striatum encode value and motivation

Affiliations

Separate populations of neurons in ventral striatum encode value and motivation

Gregory B Bissonette et al. PLoS One. .

Abstract

Neurons in the ventral striatum (VS) fire to cues that predict differently valued rewards. It is unclear whether this activity represents the value associated with the expected reward or the level of motivation induced by reward anticipation. To distinguish between the two, we trained rats on a task in which we varied value independently from motivation by manipulating the size of the reward expected on correct trials and the threat of punishment expected upon errors. We found that separate populations of neurons in VS encode expected value and motivation.


Conflict of interest statement

Competing Interests: The authors have declared that no competing interests exist.

Figures

Figure 1
Figure 1. Task and behavior.
A–B. House lights signaled the rat to nose poke into the center odor port and wait 500 ms before odor delivery. Two odors indicated the size (large or small) of the reward to be delivered at the end of the trial. If an error was committed on large and small reward trials, no reward was delivered. A third odor indicated that a small reward would be delivered on correct trials and that quinine would be delivered when rats responded to the wrong well. Odor presentation lasted 500 ms and was followed by a 250–500 ms post-odor variable delay, which ended with the onset of directional cue lights. Directional lights illuminated for 200 ms on either the left or right, instructing the rat to respond to the left or right fluid well, respectively. Clear drop = sucrose; gray drop = quinine. Arrow represents direction of the behavioral response. C. Average lick rate over time during recording sessions. Black = delivery of large reward; Dark gray = delivery of small reward when there was no risk; Light gray = delivery of small reward when there was a risk of quinine. Dashed gray = delivery of quinine on risk trials during which rats went to the wrong fluid well. D. Average percent correct for the three trial types. E. Average time taken to move from the odor port to the fluid well in response to the spatial cue lights. F. Locations of recording electrodes based on histology. Dashed black lines and black dots reflect the estimated center and bottom of the electrode track based on histology. Boxes represent locations were cue and reward responsive neurons were found.
Figure 2
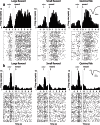
Figure 2. Single cell examples.
Single cell examples of neurons that exhibited firing patterns consistent with value and motivation encoding on correct trials for the 3 trial-types: large reward, small reward, and punishment. Activity is aligned to odor onset (left of dashed box) and reward delivery (right of dashed box). Inset: average waveform (not inverted). A. Neuron that exhibited increased firing to odor cues and reward delivery (increasing-type), and was modulated by value during odor sampling. B. Neuron that increased firing to cues and decreased firing to rewards (decreasing-type). Activity of this neuron reflected motivation, firing stronger for large reward (left) and punishment (right) trials over small reward (middle).
Figure 3
Figure 3. Population activity.
Average normalized firing over all neurons that showed significant increases to both odor cues and reward delivery (A) and those neurons that showed significant increased and decreased firing to cues and rewards, respectively (B). Firing rates were normalized by subtracting the baseline and dividing by the standard deviation. Ribbons represent standard error of the mean (SEM). Blue asterisks indicate significant differences between average firing during the odor epoch (gray bar) between large reward and small reward trials (blue versus yellow; t-test; p<0.05). Red asterisks are the comparison between quinine punishment and small reward trials (red vs yellow; t-test; p<0.05). The odor epoch did not include time when lights were on. Gray dashed = onset of odors. Black dashed = earliest possible time lights could turn on. Black arrow marks the average time of reward delivery. C. Percentage of neurons with activity that was significantly modulated during the odor epoch (ANOVA). There was a significant difference in the frequency of neurons between increasing- and decreasing-type neurons that showed increases and decreases in firing to quinine relative to small reward trials (chi-square; p<0.05).
Figure 4
Figure 4. Population activity on errors.
Average normalized firing for increasing-type (A–B) and decreasing-type (C–D) neurons during choice errors (left) and early unpokes (right). Firing rates are normalized by subtracting the baseline and dividing by the standard deviation. Ribbons represent standard error of the mean (SEM). Choice errors are when rats respond to the wrong well. Early unpokes are when rats exit the odor port prior to the offset of the directional cue light. Blue asterisks indicate significant differences between average firing during the odor epoch (gray bar) between large reward and small reward trials (blue versus yellow; t-test; p<0.05). Red asterisks are the comparison between quinine punishment and small reward trials (red vs yellow; t-test; p<0.05).
Figure 5
Figure 5. Waveform and firing characteristics.
A. Distribution of waveform durations as defined by the time between two maximum amplitudes of non-inverted waveforms for increasing (top) and decreasing-type neurons (bottom). B. Distribution of average baseline firing rates taken during 1 second starting 2 seconds prior to odor onset over all trial types.
Figure 6
Figure 6. Multiple regression analysis.
A. Classification of odor-responsive neurons (n = 111) into motivation and value encoding neurons based on the slope of correlations between firing rate (odor epoch), and reward size and level of quinine risk. Black bars represent neurons that showed significant correlations when adding both size and delay into the regression model. The ‘+’ and ‘−’ indicate the slope of the correlation for size and quinine. B. Percent of neurons showing a significant (p<0.05) correlation between firing rate (odor epoch) and response speed (light off to well entry) in the regression.

References

    1. Mogenson GJ, Jones DL, Yim CY (1980) From motivation to action: functional interface between the limbic system and the motor system. Prog Neurobiol 14: 69–97. - PubMed
    1. van der Meer MA, Redish AD (2011) Ventral striatum: a critical look at models of learning and evaluation. Curr Opin Neurobiol 21: 387–392. - PMC - PubMed
    1. Barto A, editor (1995) Adaptive critics and the basal ganglia.
    1. Niv Y, Schoenbaum G (2008) Dialogues on prediction errors. Trends Cogn Sci 12: 265–272. - PubMed
    1. Sutton RaB, AG editor (1998) Reinforcement Learning: An introduction.

Publication types

LinkOut - more resources