Successful surgical treatment of an inflammatory lesion associated with new-onset refractory status epilepticus
- PMID: 23724839
- PMCID: PMC3880136
- DOI: 10.3171/2013.3.FOCUS1336
Successful surgical treatment of an inflammatory lesion associated with new-onset refractory status epilepticus
Abstract
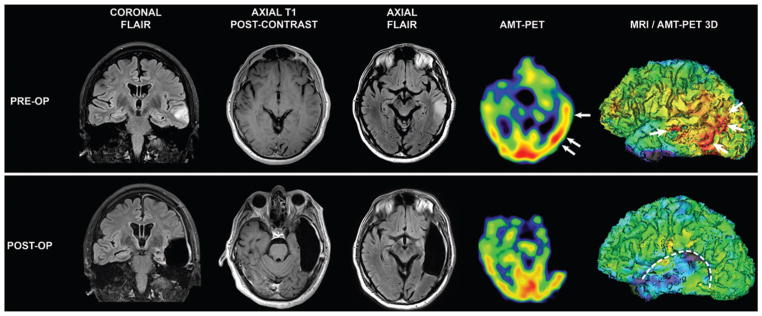
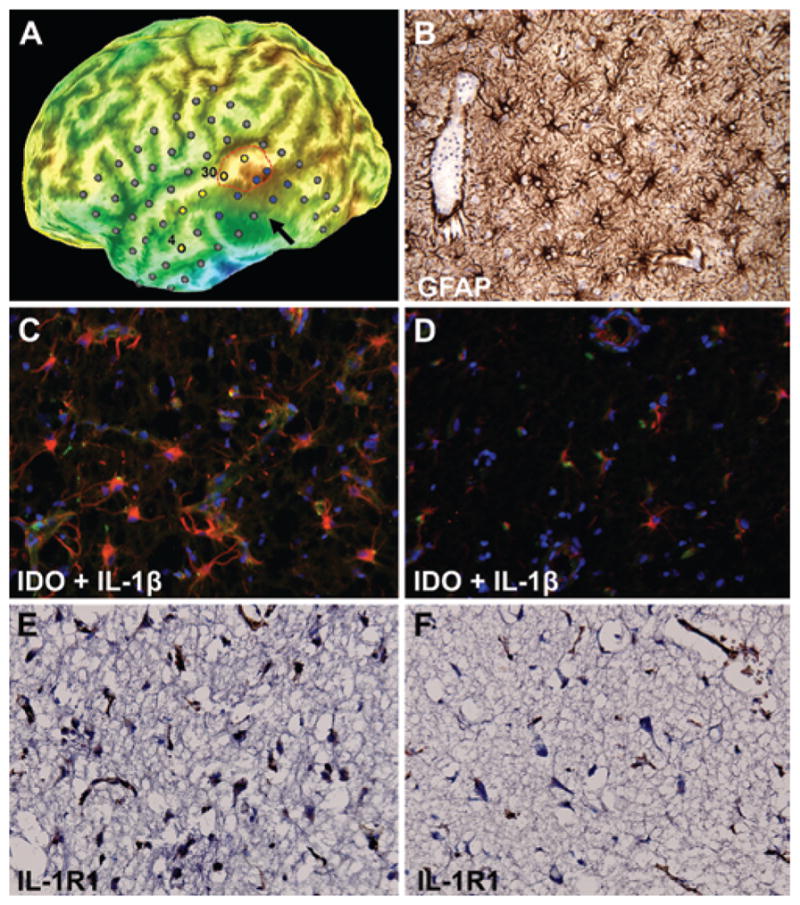
New-onset refractory status epilepticus (NORSE) has high morbidity and mortality. The authors describe the successful surgical treatment of a 56-year-old man presenting with NORSE. Magnetic resonance imaging showed a left temporal lobe lesion suspicious for a low-grade tumor, while PET imaging with the alpha[(11)C]methyl-L-tryptophan (AMT) radiotracer showed increased cortical uptake extending beyond this lesion and partly overlapping with epileptogenic cortex mapped by chronic intracranial electroencephalographic monitoring. Resection of the epileptic focus resulted in long-term seizure freedom, and the nonresected portion of the PET-documented abnormality normalized. Histopathology showed reactive gliosis and inflammatory markers in the AMT-PET-positive cortex. Molecular imaging of neuroinflammation can be instrumental in the management of NORSE by guiding placement of intracranial electrodes or assessing the extent and severity of inflammation for antiinflammatory interventions.
Conflict of interest statement
The authors report no conflict of interest concerning the materials or methods used in this study or the findings specified in this paper.
Author contributions to the study and manuscript preparation include the following. Conception and design: Mittal, Juhász, Shah. Acquisition of data: Mittal, Juhász, Buth, Kupsky, Shah. Analysis and interpretation of data: Mittal, Juhász, Buth, Kupsky, Shah. Drafting the article: Mittal, Juhász, Shah. Critically revising the article: Mittal, Juhász, D Chugani, Kupsky, H Chugani, Shah. Reviewed submitted version of manuscript: all authors. Approved the final version of the manuscript on behalf of all authors: Mittal. Administrative/technical/material support: Mittal, Juhász. Study supervision: Mittal, Juhász.
Figures
References
-
- Asano E, Chugani DC, Muzik O, Shen C, Juhász C, Janisse J, et al. Multimodality imaging for improved detection of epileptogenic foci in tuberous sclerosis complex. Neurology. 2000;54:1976–1984. - PubMed
-
- Boer K, Jansen F, Nellist M, Redeker S, van den Ouweland AM, Spliet WG, et al. Inflammatory processes in cortical tubers and subependymal giant cell tumors of tuberous sclerosis complex. Epilepsy Res. 2008;78:7–21. - PubMed
-
- Chugani DC, Chugani HT, Muzik O, Shah JR, Shah AK, Canady A, et al. Imaging epileptogenic tubers in children with tuberous sclerosis complex using alpha-[11C]methyl-L-tryptophan positron emission tomography. Ann Neurol. 1998;44:858– 866. - PubMed
-
- Chugani DC, Muzik O. Alpha[C-11]methyl-L-tryptophan PET maps brain serotonin synthesis and kynurenine pathway metabolism. J Cereb Blood Flow Metab. 2000;20:2–9. - PubMed
Publication types
MeSH terms
Substances
Grants and funding
LinkOut - more resources
Full Text Sources
Other Literature Sources
Medical