

Effects of increase in fish oil intake on intestinal eicosanoids and inflammation in a mouse model of colitis
- PMID: 23725086
- PMCID: PMC3691874
- DOI: 10.1186/1476-511X-12-81
Effects of increase in fish oil intake on intestinal eicosanoids and inflammation in a mouse model of colitis
Abstract
Background: Inflammatory bowel diseases (IBD) are chronic intestinal inflammatory diseases affecting about 1% of western populations. New eating behaviors might contribute to the global emergence of IBD. Although the immunoregulatory effects of omega-3 fatty acids have been well characterized in vitro, their role in IBD is controversial.
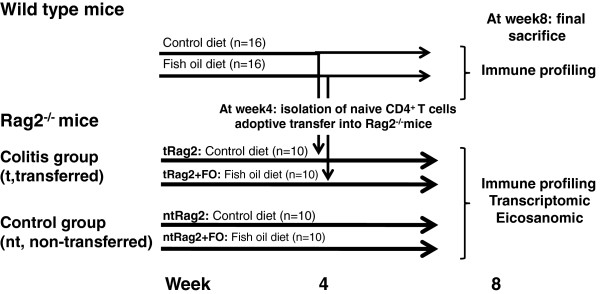
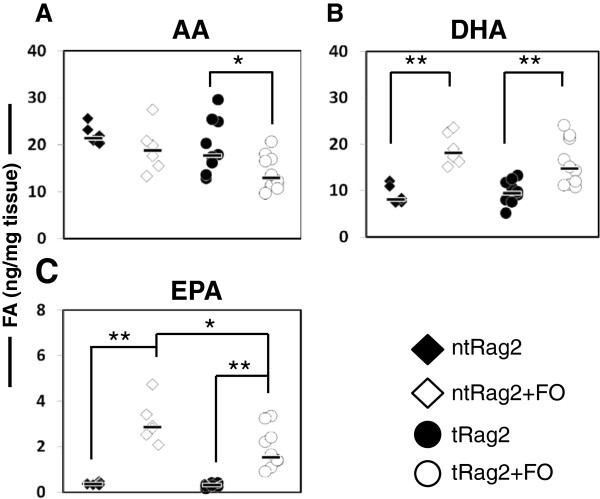
Methods: The aim of this study was to assess the impact of increased fish oil intake on colonic gene expression, eicosanoid metabolism and development of colitis in a mouse model of IBD. Rag-2 deficient mice were fed fish oil (FO) enriched in omega-3 fatty acids i.e. EPA and DHA or control diet for 4 weeks before colitis induction by adoptive transfer of naïve T cells and maintained in the same diet for 4 additional weeks. Onset of colitis was monitored by colonoscopy and further confirmed by immunological examinations. Whole genome expression profiling was made and eicosanoids were measured by HPLC-MS/MS in colonic samples.
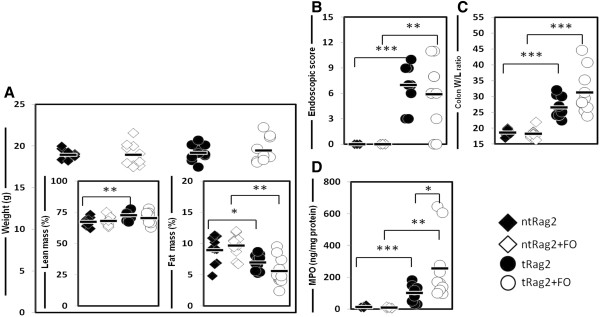
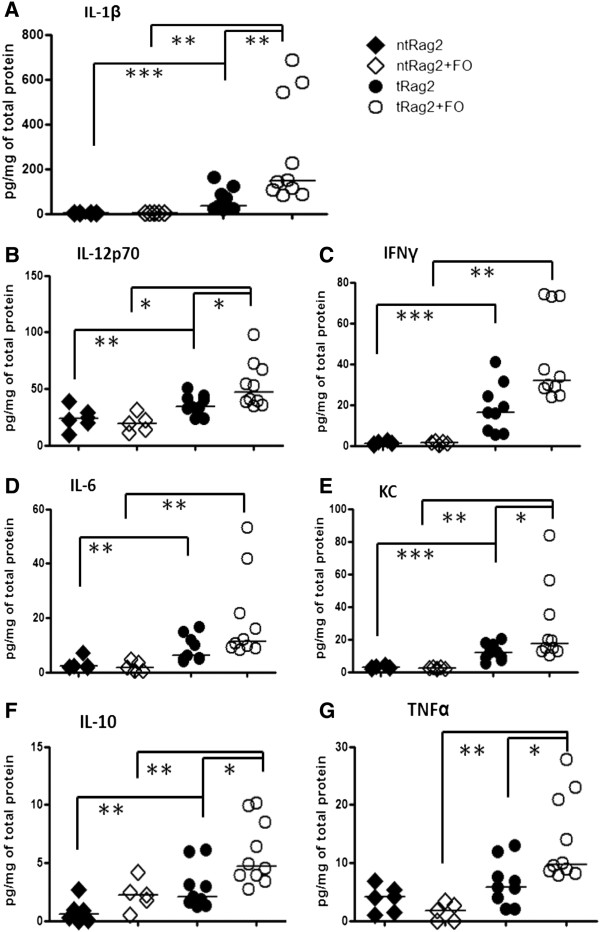
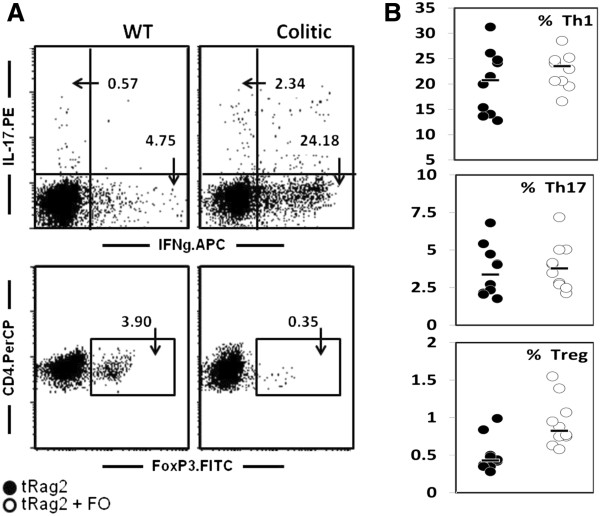
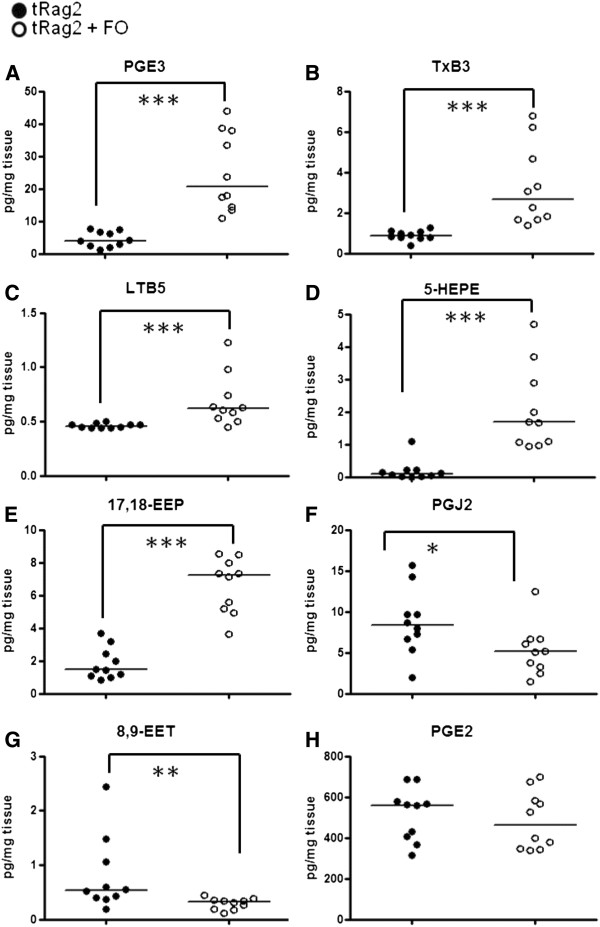
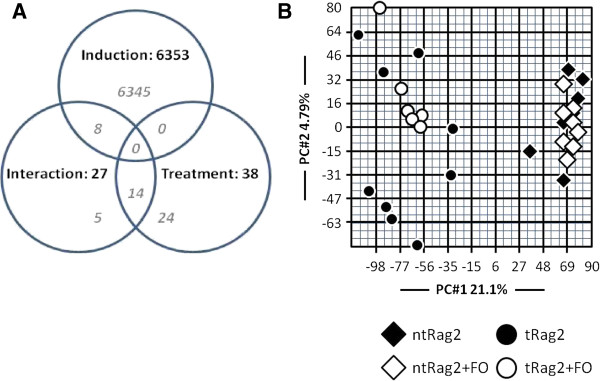
Results: A significant reduction of colonic proinflammatory eicosanoids in FO fed mice compared to control was observed. However, neither alteration of colonic gene expression signature nor reduction in IBD scores was observed under FO diet.
Conclusion: Thus, increased intake of dietary FO did not prevent experimental colitis.
Figures
Similar articles
-
Intestinal anti-inflammatory activity of combined quercitrin and dietary olive oil supplemented with fish oil, rich in EPA and DHA (n-3) polyunsaturated fatty acids, in rats with DSS-induced colitis.Clin Nutr. 2006 Jun;25(3):466-76. doi: 10.1016/j.clnu.2005.12.009. Epub 2006 May 15. Clin Nutr. 2006. PMID: 16698151
-
An arachidonic acid-enriched diet does not result in more colonic inflammation as compared with fish oil- or oleic acid-enriched diets in mice with experimental colitis.Br J Nutr. 2008 Aug;100(2):347-54. doi: 10.1017/S0007114507901257. Epub 2008 Jan 21. Br J Nutr. 2008. PMID: 18205994
-
Fish oil attenuates omega-6 polyunsaturated fatty acid-induced dysbiosis and infectious colitis but impairs LPS dephosphorylation activity causing sepsis.PLoS One. 2013;8(2):e55468. doi: 10.1371/journal.pone.0055468. Epub 2013 Feb 6. PLoS One. 2013. PMID: 23405155 Free PMC article.
-
Polyunsaturated fatty acids, inflammatory processes and inflammatory bowel diseases.Mol Nutr Food Res. 2008 Aug;52(8):885-97. doi: 10.1002/mnfr.200700289. Mol Nutr Food Res. 2008. PMID: 18504706 Review.
-
The role of marine fish oils in the treatment of ulcerative colitis.Nutr Rev. 1993 Feb;51(2):47-9. doi: 10.1111/j.1753-4887.1993.tb03067.x. Nutr Rev. 1993. PMID: 8455803 Review.
Cited by
-
Urinary Metabolic Phenotyping Reveals Differences in the Metabolic Status of Healthy and Inflammatory Bowel Disease (IBD) Children in Relation to Growth and Disease Activity.Int J Mol Sci. 2016 Aug 11;17(8):1310. doi: 10.3390/ijms17081310. Int J Mol Sci. 2016. PMID: 27529220 Free PMC article.
-
Regulation of Intestinal Inflammation by Dietary Fats.Front Immunol. 2021 Feb 2;11:604989. doi: 10.3389/fimmu.2020.604989. eCollection 2020. Front Immunol. 2021. PMID: 33603741 Free PMC article.
-
Activation of Free Fatty Acid Receptor 4 Affects Intestinal Inflammation and Improves Colon Permeability in Mice.Nutrients. 2021 Aug 6;13(8):2716. doi: 10.3390/nu13082716. Nutrients. 2021. PMID: 34444876 Free PMC article.
-
Bioactive Compounds Isolated from Microalgae in Chronic Inflammation and Cancer.Mar Drugs. 2015 Sep 30;13(10):6152-209. doi: 10.3390/md13106152. Mar Drugs. 2015. PMID: 26437418 Free PMC article. Review.
-
Omega-3 Polyunsaturated Fatty Acids and the Intestinal Epithelium-A Review.Foods. 2021 Jan 19;10(1):199. doi: 10.3390/foods10010199. Foods. 2021. PMID: 33478161 Free PMC article. Review.
References
-
- Hibbeln JR, Nieminen LR, Blasbalg TL, Riggs JA, Lands WE. Healthy intakes of n-3 and n-6 fatty acids: estimations considering worldwide diversity. Am J Clin Nutr. 2006;83:1483S–1493S. - PubMed
MeSH terms
Substances
LinkOut - more resources
Full Text Sources
Other Literature Sources
Research Materials
