Review
. 2013 Jul;126(1):29-48.
doi: 10.1016/j.bandl.2013.03.003.

The organization and physiology of the auditory thalamus and its role in processing acoustic features important for speech perception

Affiliations
Review

The organization and physiology of the auditory thalamus and its role in processing acoustic features important for speech perception

Edward L Bartlett. Brain Lang. 2013 Jul.

Abstract

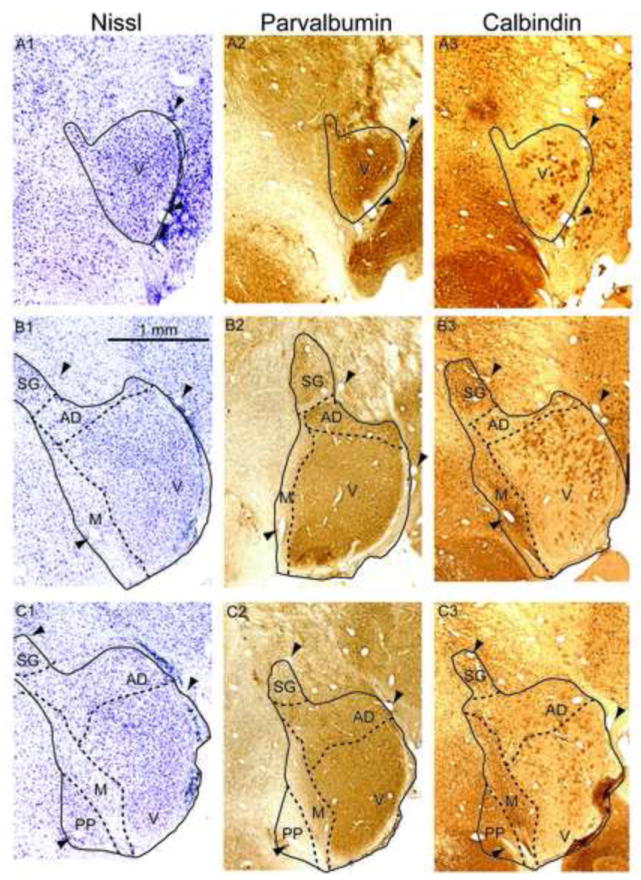
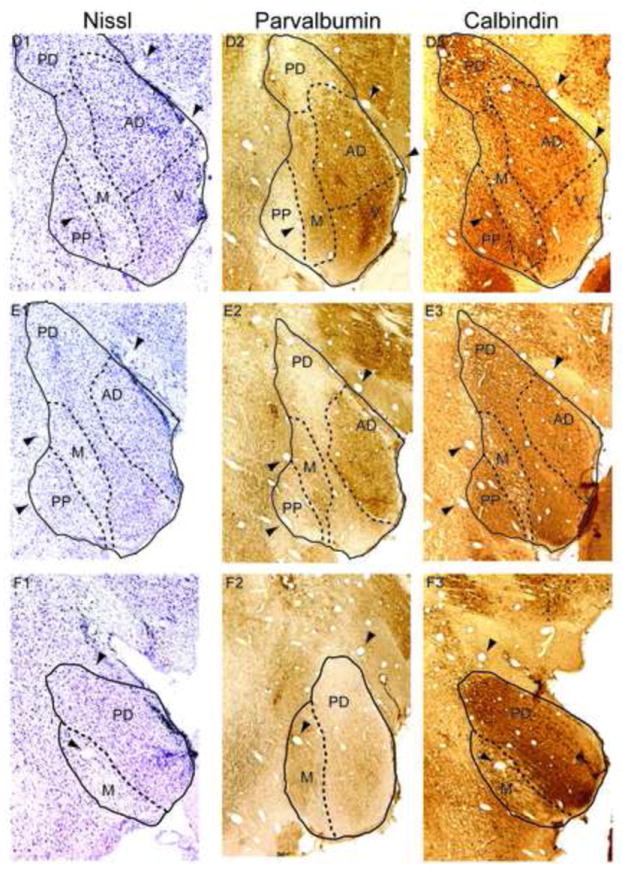
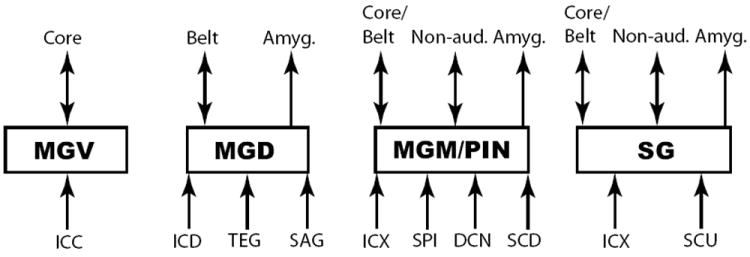
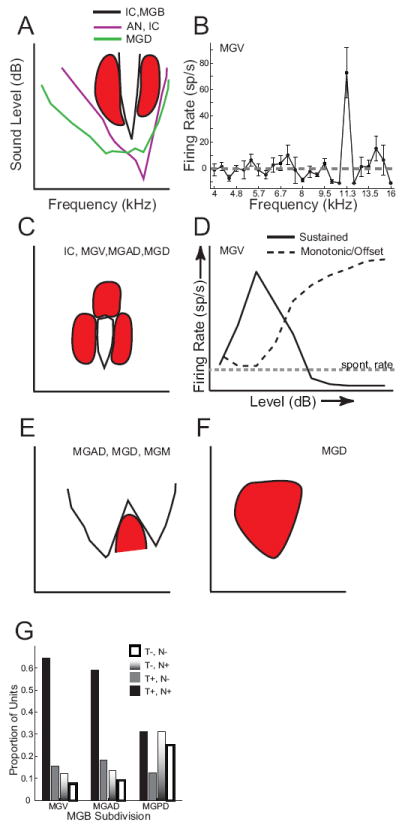
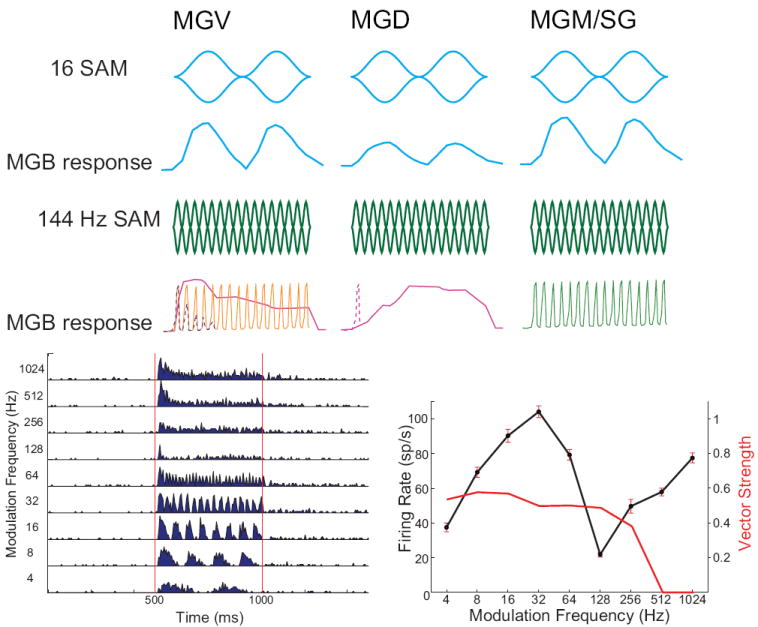
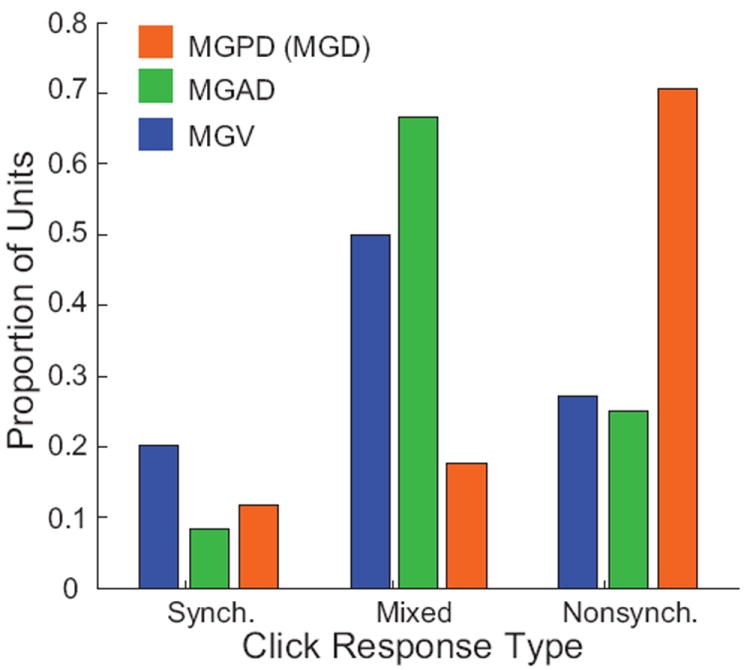
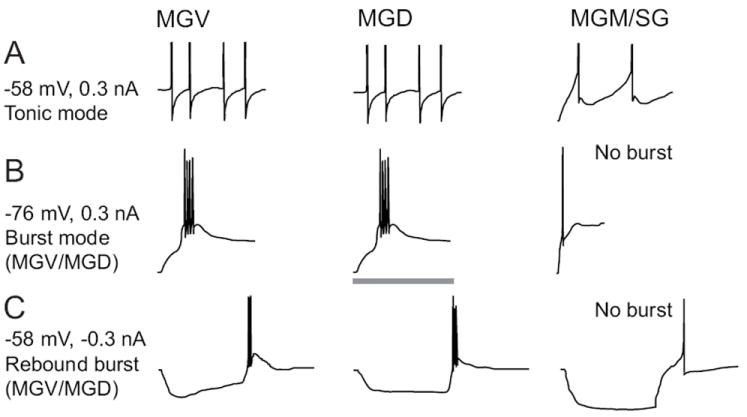
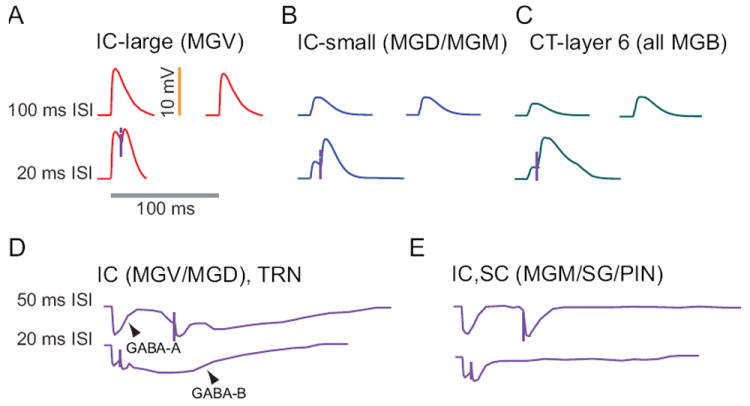
The auditory thalamus, or medial geniculate body (MGB), is the primary sensory input to auditory cortex. Therefore, it plays a critical role in the complex auditory processing necessary for robust speech perception. This review will describe the functional organization of the thalamus as it relates to processing acoustic features important for speech perception, focusing on thalamic nuclei that relate to auditory representations of language sounds. The MGB can be divided into three main subdivisions, the ventral, dorsal, and medial subdivisions, each with different connectivity, auditory response properties, neuronal properties, and synaptic properties. Together, the MGB subdivisions actively and dynamically shape complex auditory processing and form ongoing communication loops with auditory cortex and subcortical structures.


Figures

Figure 1
Figure 1. Marmoset MGB and calcium binding proteins
Left column: Nissl stain, with MGB subdivisions indicated by dashed lines. Arrowheads indicate blood vessels that are found in all three adjacent sections in a row. Middle column: Parvalbumin immunostaining. Right column: Calbindin immunostaining. The topmost row (A1-A3) is the most rostral portion of MGB. Subsequent rows progress caudally by approximately 240 m per row. Abbreviations: V, ventral division, PD, posterodorsal division, AD, anterodorsal division, M, medial division, SG, suprageniculate nucleus, PP, peripeduncular region.
Figure 2
Figure 2. Connectivity of MGB subdivisions
A diagram of the main inputs and projection targets of each main subdivision is shown. Core and belt refer to primary and non-primary auditory cortical regions, respectively. Double-headed arrows indicate bidirectional projections between two areas. Abbreviations: MGV, ventral division, MGD, dorsal division (includes posterodorsal division), MGM, medial division, SG, suprageniculate nucleus, PIN, posterior intralaminar nucleus, SCU, superior colliculus – upper layers, SCD, superior colliculus – deep layers ICC, central nucleus of the inferior colliculus, ICD, dorsal cortex of the inferior colliculus, ICX, external cortex of the inferior colliculus, SAG, sagulum, TEG, tegmentum, DCN, dorsal cochlear nuclei, SPI, spinal cord, Amyg., amygdala, Non-aud., non-auditory cortex, Ach, acetylcholine, Norad., noradrenaline, 5-HT, serotonin, TRN, thalamic reticular nucleus. Neuromodulators (ACh, Norad., 5-HT) go to all MGB subdivisions. All MGB subdivisions send collaterals to and receive inputs from TRN.
Figure 3
Figure 3. Main tone frequency response area shapes in different MGB subdivisions
Schematic frequency response areas are shown with frequency along the x-axis and sound level along the y-axis. Axes in A apply to A, C, E, F. Responsive regions fall above (A,,E) or within the area (C) bounded by the solid lines and not within the red inhibited regions. A: In the auditory nerve (AN) and in many IC neurons, frequency tuning widens with sound level, especially on the low-frequency side. In MGV, MGAD, MGM and IC, many neurons have narrow excitatory tuning that is flanked by lateral inhibition (red shapes). If the rate-level function is monotonic or plateaus, the top of the FRA will be open. In MGD, frequency tuning for tones is often broad (green line). B: Example of a narrowly tuned MGV neuron (adapted from Bartlett and Wang 2011), showing firing rate as a function of tone frequency. With 1/12 octave spacing between tones, only one tone was strongly excitatory, and this was flanked on both the low and high frequency sides by strong inhibition that made the firing rate go below the spontaneous rate (gray dashed line). C: Similar narrow tuning as in A (solid black lines), but the rate-level function is non-monotonic, such that firing rates decrease for high sound levels. This is likely to be due to inhibition at high levels (red shape at top of FRA). This means that there is a restricted frequency and level range over which there is evoked excitation. D: Examples of sound level tuning in MGB neurons. The dashed line shows a monotonic increase in rate with increasing sound level, which can be found in all species to varying degrees and is found in lower auditory nuclei. The solid line shows a non-monotonic rate-level curve, where firing rate rises to a maximum at the neuron’s best level and then decreases for louder levels, sometimes becoming inhibited below the neuron’s spontaneous rate (gray dashed line). Non-monotonic responses are prevalent in primate MGB, and in these units, there is often an offset response at higher sound levels that rises monotonically, which is also represented by the black dashed line. In other neurons in MGD, tones generate inhibition that may or may not be followed by an offset response (not shown). E: MGAD, MGD, and MGM neurons have a moderate proportion of multi-peaked FRAs, with two or more excitatory peaks separated by elevated thresholds or inhibition. These multipeaked FRAs can also be non-monotonic (not shown) F: Some MGD neurons are only inhibited by F: Proportion of neurons responsive (T+) or unresponsive (T-) to tones and neurons responsive (N+) or unresponsive (N-) to noise for MGV, MGAD and MGPD (MGD). MGPD neurons had a much higher proportion of units that were inhibited or unresponsive to tones and noise (T-,N-) or only responsive to noise (T-,N+) compared to MGAD and MGV.
Figure 4
Figure 4. Responses to sinusoidal amplitude modulation in different MGB subdivisions
Top row: Modulation waveforms for 16 Hz sinusoidal AM (SAM), 100% modulation depth. Second row: MGB response to 16 Hz SAM. For low modulation frequencies (<32 Hz), MGV neurons (left) represent both periodicity and modulation waveform in their discharges. Firing rate curves represent peristimulus time histogram (PSTH) responses. MGD neurons (middle), if responsive, often have lower evoked firing rates but are often sometimes synchronized for low modulation frequencies. MGM neurons (right) respond similarly to MGV neurons at low modulation frequencies despite receiving IC inputs with different tuning and axon terminal sizes. Third row: Modulation waveforms for 144 Hz sinusoidal AM, 100% modulation depth. Fourth row: MGV neurons have three common responses to high frequency AM when recording from unanesthetized animals. Left: Some MGV neurons respond only phasically (dashed line). Others are able to maintain synchronized responses for the duration of the AM stimulus. Some MGV neurons respond with sustained increases in firing rate that are not synchronized with the AM modulation frequency. Middle: Most MGD neurons, when responsive, generate a long-latency sustained increase in firing rate for rapid AM stimuli (solid line) or just a brief onset (dashed line). Right: Many MGM neurons (guinea pig) and anterodorsal neurons (marmoset) are able to represent rapid temporal modulations with relatively precise synchrony compared to other MGB subdivisions. Fifth row, left: Example of a MGV neuron response to SAM. Same neuron as Fig. 6B. SAM tone, carrier frequency = 6.96 kHz, 70 dB SPL, 4-1024, 1 octave steps. Shown is the PSTH in response to SAM sounds. Red lines show when sound was playing. Fifth row, right: Mean firing rate (solid line) ± SEM for same unit. Also shown is vector strength (red line), where those that were not significantly synchronized were set to 0.
Figure 5
Figure 5. Neural representations of click stimuli by MGB subdivision
Adapted from Bartlett and Wang (2011). Proportion of response categories for responses to repetitive click trains in different MGB subdivisions. MGPD neurons had a much higher proportion of non-synchronized responses that MGV or MGAD neurons.
Figure 6
Figure 6. Intrinsic membrane properties of neurons in different MGB subdivisions
A: Intracellular voltage responses to injections of depolarizing currents. The resting membrane potential (-58 mV) and magnitude of injected current are shown to the left. Depolarization of MGV (left) and MGD (middle) neurons produces a series of single action potentials with monophasic afterhyperpolarizations (AHPs). MGM/SG (right) neurons produces single spikes that adapt and have biphasic AHPs due to activation of a small-conductance, calcium-activated potassium channel. B: Injection of depolarizing current starting from a hyperpolarized membrane potential (-76 mV) evokes burst responses in MGV and MGD neurons. The burst response consists of a large calcium-dependent depolarization evoked by activation of T-type calcium channels and 2-5 high-frequency action potentials (250-500 Hz) evoked at the peak of the calcium burst. About half of MGM/SG neurons produce calcium bursts, while about half have weak or absent calcium bursts, such as the example shown. C: Injection of hyperpolarizing current produces “rebound” burst responses in MGV and MGD neurons and about half of MGM/SG neurons. The other half of MGM/SG neurons fail to evoke a rebound burst, which is quite unusual for neurons in most thalamic nuclei. The gray bar represents 100 ms in A, 40 ms in B, and 200 ms in C.
Figure 7
Figure 7. Excitatory and inhibitory postsynaptic potentials (EPSPs and IPSPs) in MGB neurons
Top row, 100 ms interstimulus interval (ISI): Intracellular recordings of synaptic potentials evoked by sound or electrical stimulation of IC axons show that about half of MGV neurons produce large EPSPs (A). For 100 ms ISI, there is little difference between the first and second EPSPs. Small excitatory IC responses (B) are evoked in nearly all MGD neurons and about half of MGV neurons. Corticothalamic responses are similar throughout MGB, consisting of quite small EPSPs. Even for 100 ms ISI, corticothalamic responses (C) produce significant facilitation of their responses. Second row, 20 ms ISI. For briefer ISI, MGV neurons receiving large IC inputs (A) exhibit strong synaptic depression that limits the amount of depolarization produced by the second EPSP. By contrast, MGD and MGV neurons that receive small terminal IC input produce synaptic facilitation for short ISI (B). Corticothalamic inputs (C) demonstrate strong synaptic facilitation and show an enhanced NMDA component, especially for repetitive stimulation. Third row, 50 ms ISI: Inhibition from IC or TRN produces very similar IPSPs in MGV and MGD neurons (D). in MGV and MGD and IC and SC inhibition in MGM/SG/PIN (E) Electrical stimulation of their axons produces a short-latency GABAA receptor mediated response and a long-latency, metabotropic GABAB receptor mediated response that lasts for 200-400 ms. For 50 ms ISI, there is little depression of the GABAA response, and the GABAB hyperpolarization is just beginning when the second response is evoked. MGM neurons receive inhibitory inputs from IC and the superior colliculus. They differ from inputs to MGV and MGD in that there is no clear GABAB response (E). Bottom row, 20 ms ISI: For shorter ISI in MGV and MGD neurons, the GABAA induced hyperpolarization is slightly larger for the second pulse, indicating little or no depression of the early inhibitory response (D). The GABAB responses merge to produce a larger hyperpolarization than the GABAB IPSPs evoked by single stimuli. MGM responses are similar but lack the GABAB response (E).
Figure 8
Figure 8. Example of responses of neuron to natural and reversed marmoset vocalizations
Dot raster representations. Each row represents a single sound presentation. Dots represent action potentials. Neuron was in MGV of marmoset. The sound level for all vocalizations was 50 dB SPL. Firing rates are mean ± SD. Red dashed lines in the top two boxes indicate a 200 ms time window over which there was the most significant difference in firing rates between the natural and reversed peeptrill calls.

References

    1. Abrams DA, Nicol T, Zecker S, Kraus N. A possible role for a paralemniscal auditory pathway in the coding of slow temporal information. Hear Res. 2011;272(1-2):125–134. - PMC - PubMed
    1. Aitkin LM, Dunlop CW, Webster WR. Click-evoked response patterns of single units in the medial geniculate body of the cat. Journal of Neurophysiology. 1966;29:109–123. - PubMed
    1. Aitkin LM, Prain SM. Medial geniculate body: unit responses in the awake cat. Journal of Neurophysiology. 1974;37:512–521. - PubMed
    1. Aitkin L. Rate-level functions of neurons in the inferior colliculus of cats measured with the use of free-field sound stimuli. Journal of Neurophysiology. 1991;65:383–92. - PubMed
    1. Allon N, Yeshurun Y, Wollberg Z. Responses of single cells in the medial geniculate body of awake squirrel monkeys. Experimental Brain Research. 1981;41:222–232. - PubMed

Publication types

MeSH terms