

Comparative analysis of mass spectral matching-based compound identification in gas chromatography-mass spectrometry
- PMID: 23726352
- PMCID: PMC3686837
- DOI: 10.1016/j.chroma.2013.05.021
Comparative analysis of mass spectral matching-based compound identification in gas chromatography-mass spectrometry
Abstract
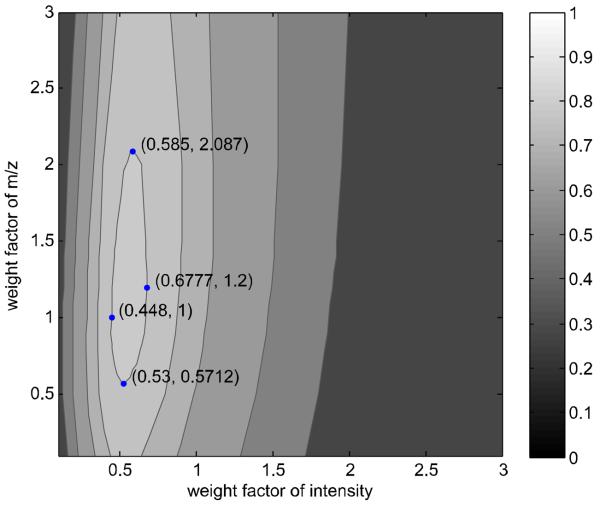
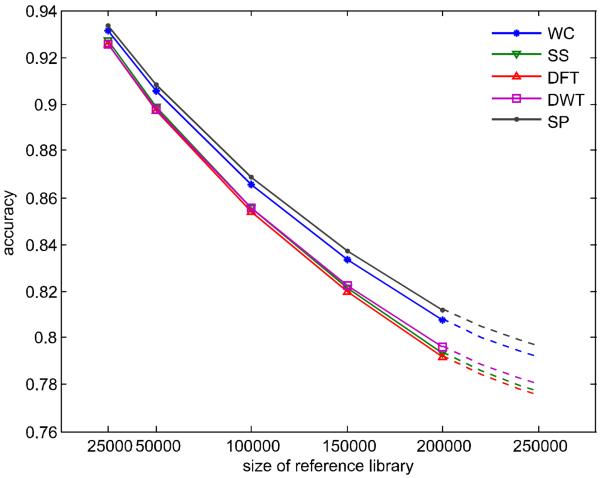
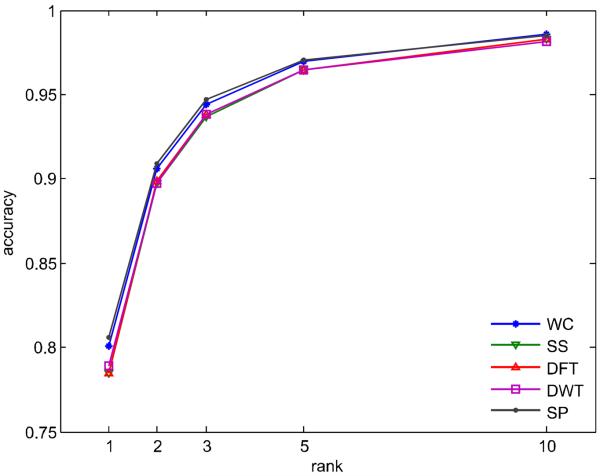
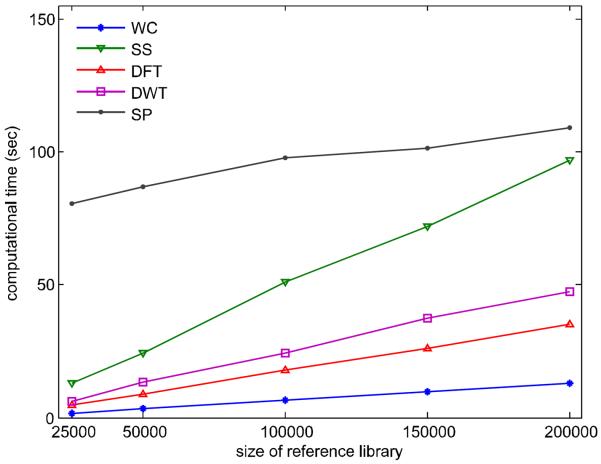
Compound identification in gas chromatography-mass spectrometry (GC-MS) is usually achieved by matching query spectra to spectra present in a reference library. Although several spectral similarity measures have been developed and compared using a small reference library, it still remains unknown how the relationship between the spectral similarity measure and the size of reference library affects on the identification accuracy as well as the optimal weight factor. We used three reference libraries to investigate the dependency of the optimal weight factor, spectral similarity measure and the size of reference library. Our study demonstrated that the optimal weight factor depends on not only spectral similarity measure but also the size of reference library. The mixture semi-partial correlation measure outperforms all existing spectral similarity measures in all tested reference libraries, in spite of the computational expense. Furthermore, the accuracy of compound identification using a larger reference library in future is estimated by varying the size of reference library. Simulation study indicates that the mixture semi-partial correlation measure will have the best performance with the increase of reference library in future.
Copyright © 2013 Elsevier B.V. All rights reserved.
Figures
References
-
- Stein SE, Scott DR. Journal of the American Society for Mass Spectrometry. 1994;5:859. - PubMed
-
- Hertz HS, Hites RA, Biemann K. Analytical Chemistry. 1971;43:681.
-
- Atwater BL, Stauffer DB, Mclafferty FW, Peterson DW. Analytical Chemistry. 1985;57:899.
-
- Julian RK, Higgs RE, Gygi JD, Hilton MD. Analytical Chemistry. 1998;70:3249. - PubMed
-
- Rasmussen GT, Isenhour TL. Journal of Chemical Information and Computer Sciences. 1979;19:179.
Publication types
MeSH terms
Grants and funding
LinkOut - more resources
Full Text Sources
Other Literature Sources
Miscellaneous
