. 2013 Jun 10;25(5):463-77.
doi: 10.1016/j.devcel.2013.05.001. Epub 2013 May 30.

TIGAR is required for efficient intestinal regeneration and tumorigenesis

Affiliations

TIGAR is required for efficient intestinal regeneration and tumorigenesis

Eric C Cheung et al. Dev Cell. .

Abstract

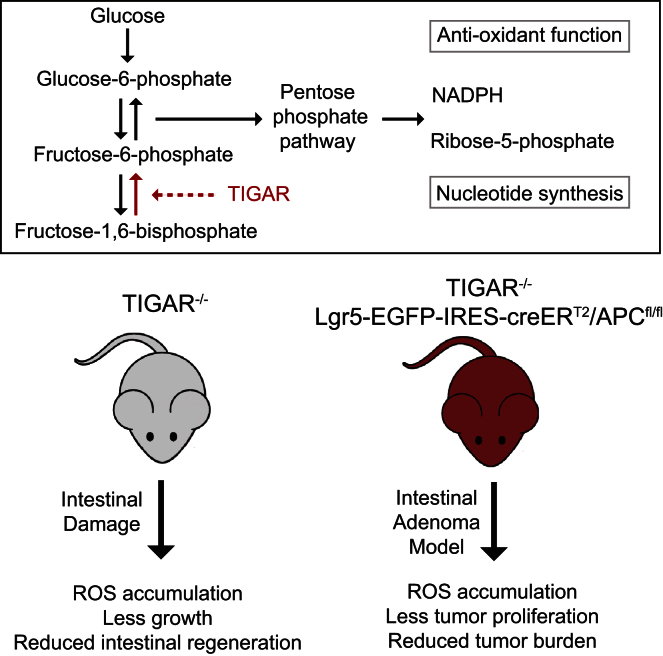
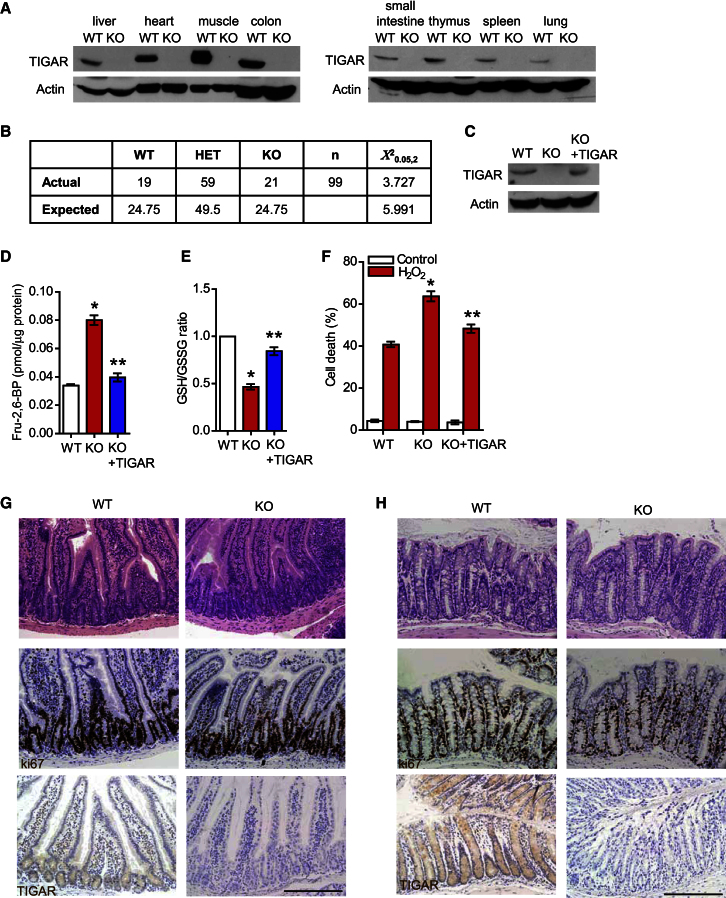
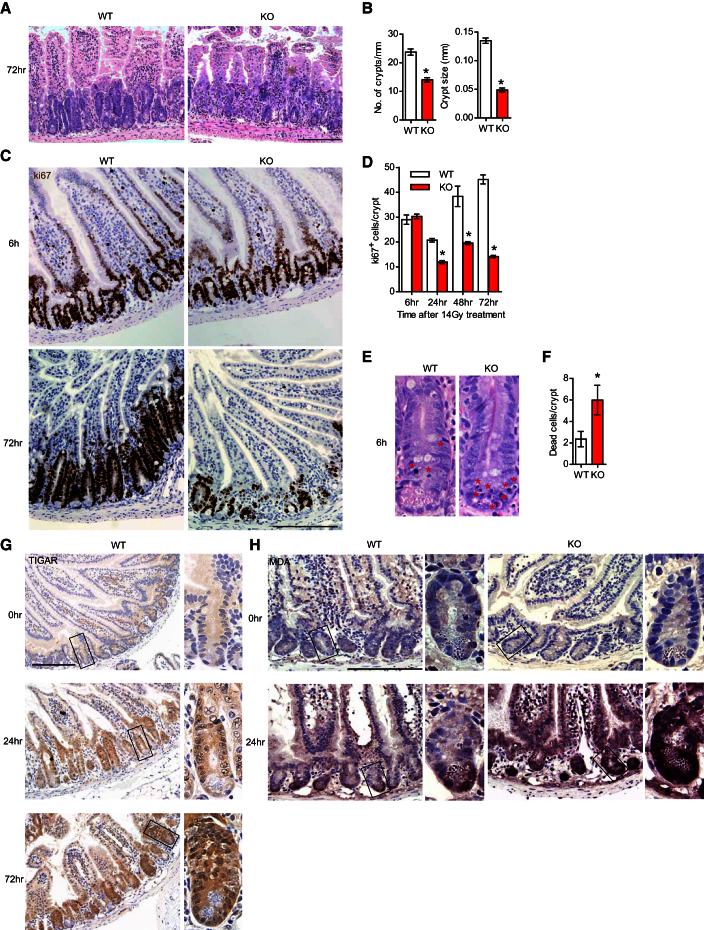
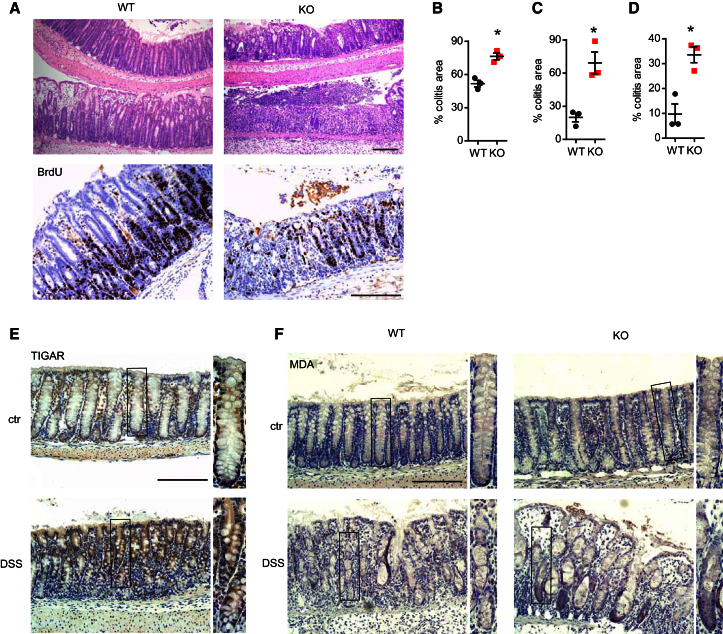
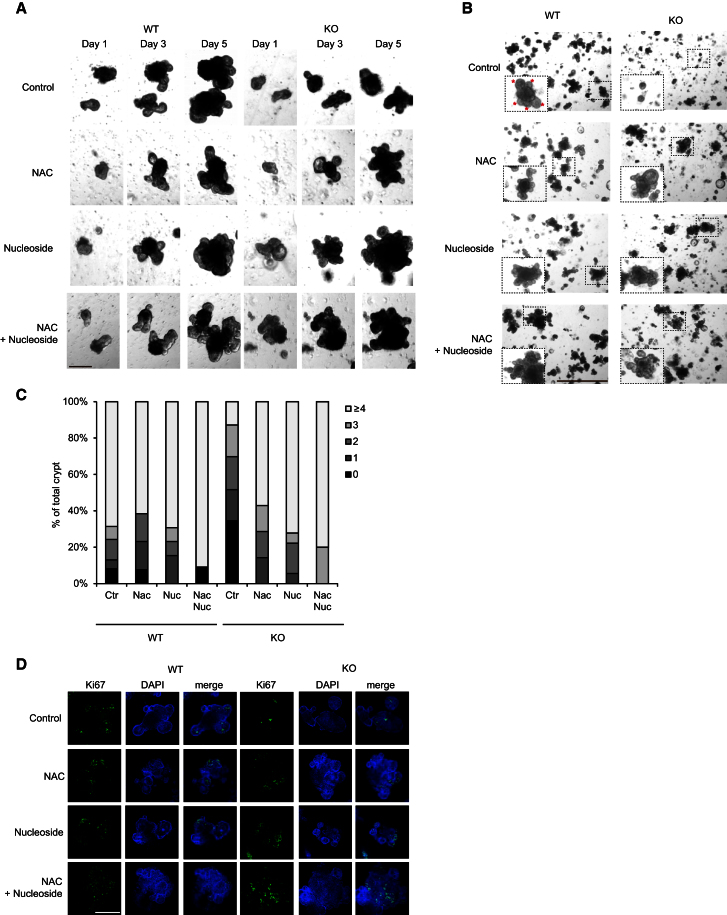
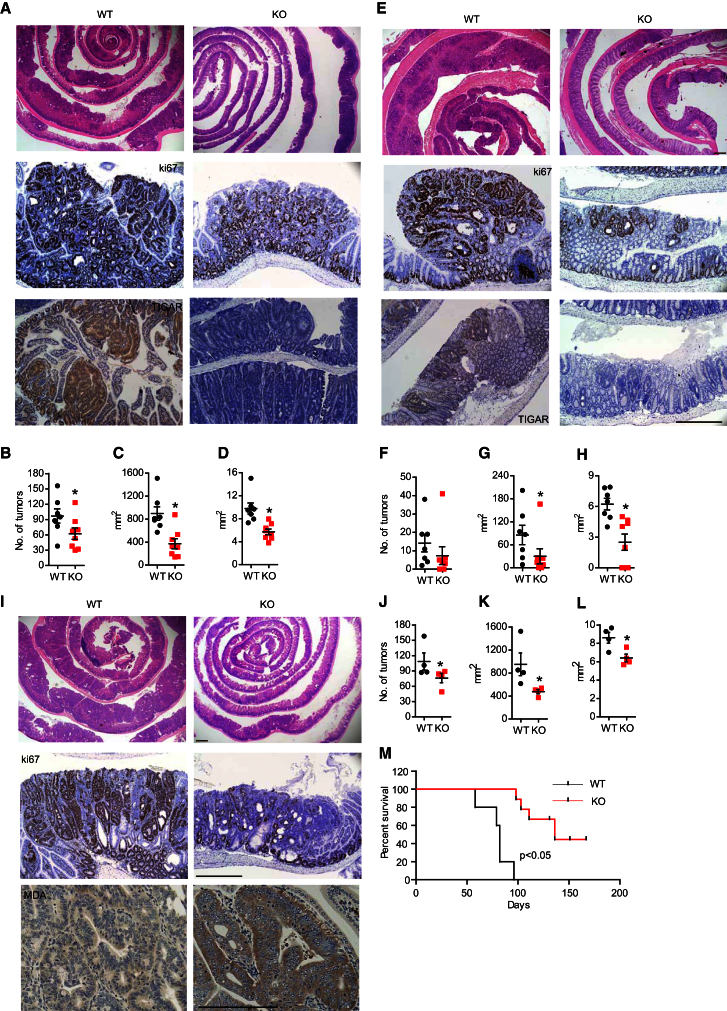
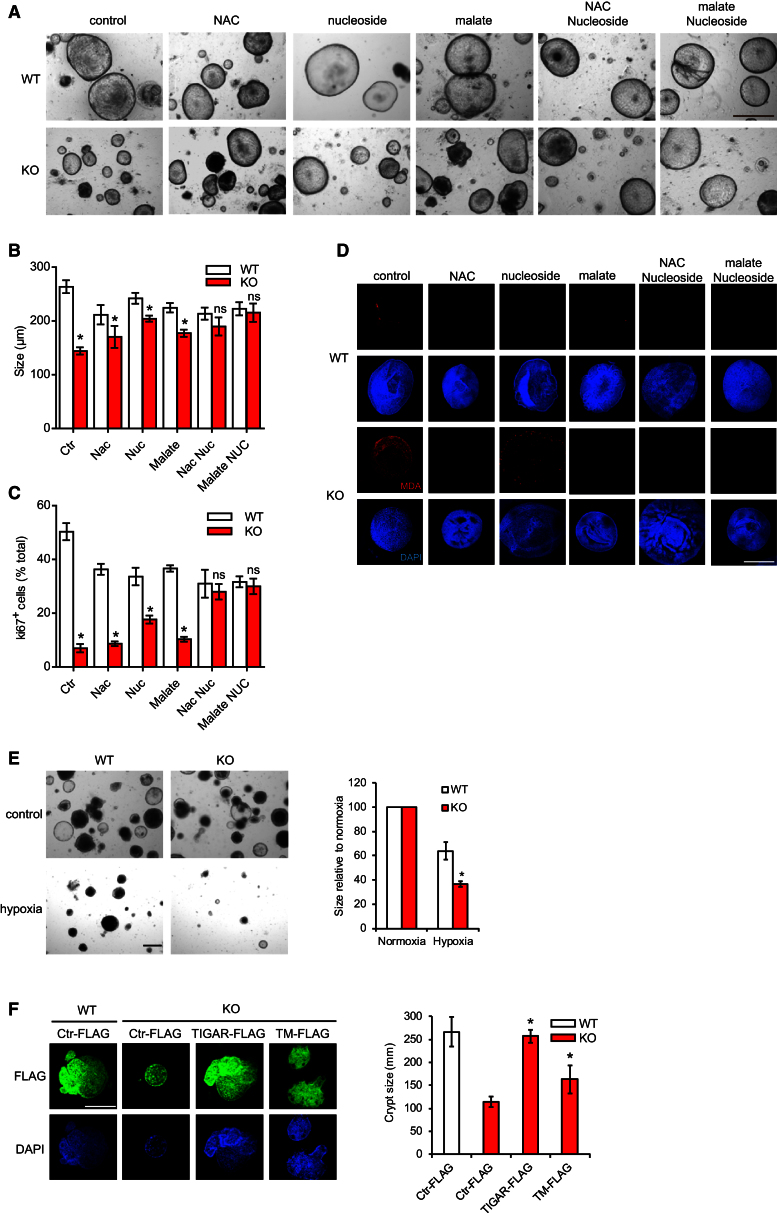
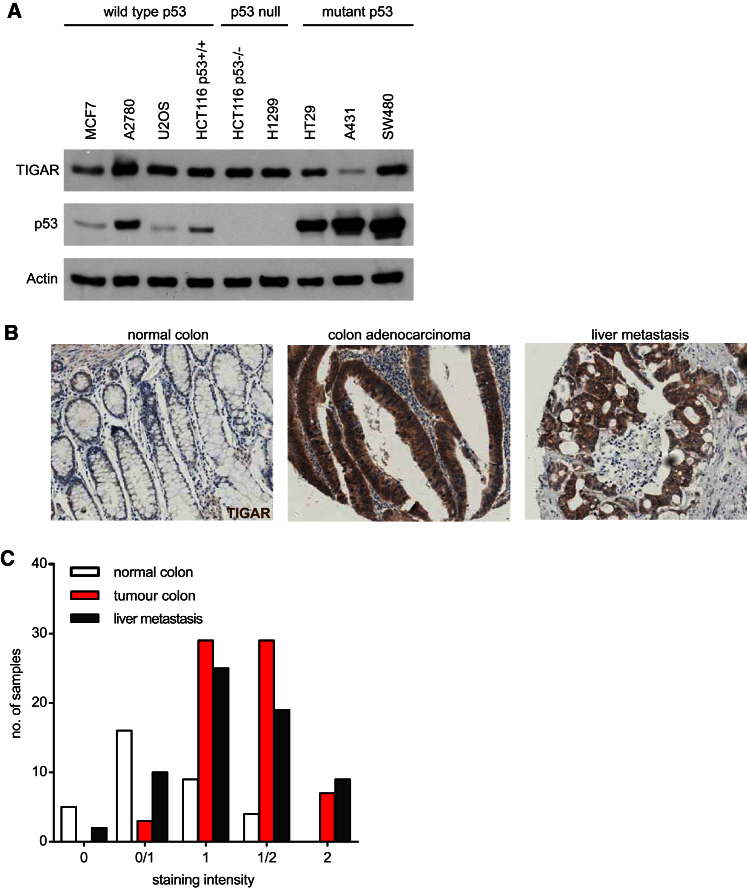
Regulation of metabolic pathways plays an important role in controlling cell growth, proliferation, and survival. TIGAR acts as a fructose-2,6-bisphosphatase, potentially promoting the pentose phosphate pathway to produce NADPH for antioxidant function and ribose-5-phosphate for nucleotide synthesis. The functions of TIGAR were dispensable for normal growth and development in mice but played a key role in allowing intestinal regeneration in vivo and in ex vivo cultures, where growth defects due to lack of TIGAR were rescued by ROS scavengers and nucleosides. In a mouse intestinal adenoma model, TIGAR deficiency decreased tumor burden and increased survival, while elevated expression of TIGAR in human colon tumors suggested that deregulated TIGAR supports cancer progression. Our study demonstrates the importance of TIGAR in regulating metabolism for regeneration and cancer development and identifies TIGAR as a potential therapeutic target in diseases such as ulcerative colitis and intestinal cancer.


Figures

None
Graphical abstract
Figure 1
Figure 1
TIGAR-Deficient Mice (A) Western blot analysis of the indicated tissues from WT and TIGAR-deficient animals. (B) Mendelian ratio from TIGAR+/− matings. (C) Western blot analysis of baby mouse kidney (BMK) cultures from wild-type (WT), TIGAR−/− (KO), and KO cultures transfected with human TIGAR construct. (D) Level of fructose-2,6-bisphosphate in WT, KO, and KO BMK cell cultures transfected with TIGAR construct (KO + TIGAR). p < 0.05 compared to WT; ∗∗p < 0.05 compared to KO. (E) Ratio of oxidized and reduced glutathione (GSH/GSSG) of WT, KO, and KO + TIGAR BMK cells. p < 0.05 compared to WT; ∗∗p < 0.05 compared to KO. (F) Cell death as measured by PI exclusion of WT, KO, and KO + TIGAR BMK cells after hydrogen peroxide treatment. p < 0.05 compared to WT; ∗∗p < 0.05 compared to KO. (G and H) Untreated small intestine (G) and colon (H) from WT and KO animals. Top: hematoxylin and eosin staining (H&E); middle: Ki67; bottom: TIGAR staining. Scale bar, 200 μm. Data are represented as mean ± SEM (n = at least 3). See also Figure S1.
Figure 2
Figure 2
TIGAR-Deficient Mice Have Reduced Regenerative Capacity in the Intestinal Crypt after 14 Gy Whole-Body IR (A) Small intestine from WT and TIGAR−/− (KO) animals 72 hr after 14 Gy IR. Bar = 200 μm. (B) Number of crypts per millimeter (left) and size of crypts (right) 72 hr after 14 Gy IR. p < 0.05 compared to WT. (C) Ki67 staining of WT and KO intestines 6 and 72 hr after 14 Gy IR. Bar = 200 μm. (D) Quantification of Ki67+ cells at the indicated times after 14 Gy IR. p < 0.05 compared to WT. (E) Apoptosis in the small intestine 6 hr after 14 Gy IR. Asterisks denote cells with apoptotic nuclear morphology. (F) Number of apoptotic cells in the crypts 6 hr after 14 Gy IR. p < 0.05 compared to WT. (G) TIGAR staining of WT animals before IR and 24 and 72 hr after 14 Gy IR. Scale bar, 200 μm. Panels show details of crypt structures indicated in the box. (H) Malondialdehyde (MDA) staining of WT and KO animals before and 24 hr after 14 Gy IR. Scale bar, 200 μm. Data are represented as mean ± SEM (n = at least 3). See also Figure S2.
Figure 3
Figure 3
TIGAR-Deficient Mice Are More Sensitive to DSS-Induced Colitis (A) Colon from WT and TIGAR−/− (KO) animals 2 days after 2% DSS treatment. Top: H&E; bottom: BrdU staining. Bar = 200 μm. (B) Percentage of colitis area one day after 3.5% DSS in WT and KO animals. p < 0.05 compared to WT. (C) Percentage of colitis area one day after 2% DSS in WT and KO animals. p < 0.05 compared to WT. (D) Percentage of colitis area 2 days after 2% DSS in WT and KO animals. p < 0.05 compared to WT. (E) TIGAR staining in WT animals, untreated (ctr) or after 3.5% DSS treatment. Scale bar, 200 μm. Panels show details of crypt structures indicated in the box. (F) MDA staining of WT and KO animals before and after 2% DSS treatment. Scale bar, 200 μm. Data are represented as mean ± SEM (n = at least 3). See also Figure S3.
Figure 4
Figure 4
Reduction of Proliferation in TIGAR-Deficient Intestinal Crypt Can Be Rescued by the Addition of ROS Scavengers and Nucleoside (A) Crypt cultures from WT and TIGAR/ (KO) small intestines after the indicated treatment. The same crypts were followed on days 1, 3, and 5. Scale bar, 100 μm. (B) Crypt cultures from WT and KO small intestines 5 days after the indicated treatment. Asterisks indicate growing buds from the crypt. Scale bar, 300 μm. (C) Quantification of the number of buds (0 to ≥4) from the crypts from WT and KO small intestinal crypt cultures. (D) Ki67 staining of the crypt cultures from WT and KO small intestine treated with the indicated drugs for 5 days. Scale bar, 100 μm. See also Figure S4.
Figure 5
Figure 5
TIGAR Deficiency Reduced the Tumor Burden in a Mouse Model of Intestinal Adenoma (A) H&E staining (top), Ki67 staining (middle), and TIGAR staining (bottom) of the small intestines from TIGAR+/+Lgr5-EGFP-IRES-creERT2/APCfl/fl (WT) mice and TIGAR/Lgr5-EGFP-IRES-creERT2/APCfl/fl (KO) mice after multiple rounds of tamoxifen induction. (B) Number of tumors from WT and KO mice. p < 0.05 compared to WT. (C) Total tumor burden in the small intestine of WT and KO mice. p < 0.05 compared to WT. (D) Average size of tumor from WT and KO mice. p < 0.05 compared to WT. (E) H&E staining (top), Ki67 staining (middle), and TIGAR staining (bottom) of the colon from WT and KO mice after multiple dosage of tamoxifen induction. Scale bar, 200 μm. (F) Number of tumors from the colon of WT and KO mice. (G) Total colon tumor burden of WT and KO mice. p < 0.05 compared to WT. (H) Average colon tumor size of WT and KO mice. p < 0.05 compared to WT. (I) H&E staining (top), Ki67 staining (middle), and MDA staining (bottom) of the small intestines from TIGAR+/+Lgr5-EGFP-IRES-creERT2/APCfl/fl (WT) and TIGAR/Lgr5-EGFP-IRES-creERT2/APCfl/fl (KO) after a single dosage of tamoxifen induction. Scale bar, 200 μm. (J) Number of tumors from WT and KO animals. p < 0.05 compared to WT. (K) Total tumor burden in the small intestine of WT and KO animals. p < 0.05 compared to WT. (L) Average size of tumor from WT and KO animals. p < 0.05 compared to WT. (M) Kaplan-Meier survival curves showing adenoma-free survival of WT (n = 5) and KO (n = 7) mice. Data are represented as mean ± SEM (n = at least 3). See also Figure S5.
Figure 6
Figure 6
Reduction of Proliferation in TIGAR-Deficient Tumor Crypt Can Be Rescued by the Addition of Malate and Nucleoside (A) Tumor cystic organoid cultures from TIGAR+/+Lgr5-EGFP-IRES-creERT2/APCfl/fl (WT) and TIGAR/Lgr5-EGFP-IRES-creERT2/APCfl/fl (KO) small intestines after the indicated treatment for 5 days. Bar = 100 μm. (B) Quantification (average diameter of the organoids) of (A). p < 0.05 compared to WT. ns, no significant difference. (C) Quantification of the percentage of Ki67-positive cells in the tumor crypt cultures from WT and KO animals treated with the indicated treatments for 5 days. p < 0.05 compared to WT. ns, no significant difference. (D) MDA staining of the tumor crypt cultures from WT and KO animals with the indicated treatments for 5 days. Scale bar, 100 μm. (E) Size of TIGAR-deficient and control crypts following exposure to 1% oxygen (hypoxia) for 5 days. p < 0.05 compared to WT. (F) TIGAR-deficient and control crypts were electroporated with the indicated constructs and then cultured for 5 days. Crypts expressing comparable levels of each protein, as visualized by FLAG staining, were measured for size. p < 0.05 compared to KO with Ctr-FLAG. Data are represented as mean ± SEM (n = 3). See also Figure S6.
Figure 7
Figure 7
Increased TIGAR Expression in Primary Human Colon Cancer and Associated Metastases (A) Expression of TIGAR in various human cancer cell lines with different p53 status. (B) Example of TIGAR staining in matched samples of human normal colon, colon adenocarcinoma, and liver metastasis from the same patient. (C) Quantification of the staining intensity in normal human colon, primary adenocarcinoma (tumor), and liver metastases.

Comment in

  • Metabolism: a TIGAR tale.
    McCarthy N. McCarthy N. Nat Rev Cancer. 2013 Aug;13(8):522. doi: 10.1038/nrc3567. Epub 2013 Jul 4. Nat Rev Cancer. 2013. PMID: 23822981 No abstract available.

References

    1. Anastasiou D., Poulogiannis G., Asara J.M., Boxer M.B., Jiang J.K., Shen M., Bellinger G., Sasaki A.T., Locasale J.W., Auld D.S. Inhibition of pyruvate kinase M2 by reactive oxygen species contributes to cellular antioxidant responses. Science. 2011;334:1278–1283. - PMC - PubMed
    1. Ashton G.H., Morton J.P., Myant K., Phesse T.J., Ridgway R.A., Marsh V., Wilkins J.A., Athineos D., Muncan V., Kemp R. Focal adhesion kinase is required for intestinal regeneration and tumorigenesis downstream of Wnt/c-Myc signaling. Dev. Cell. 2010;19:259–269. - PMC - PubMed
    1. Barker N., van Es J.H., Kuipers J., Kujala P., van den Born M., Cozijnsen M., Haegebarth A., Korving J., Begthel H., Peters P.J., Clevers H. Identification of stem cells in small intestine and colon by marker gene Lgr5. Nature. 2007;449:1003–1007. - PubMed
    1. Barker N., Ridgway R.A., van Es J.H., van de Wetering M., Begthel H., van den Born M., Danenberg E., Clarke A.R., Sansom O.J., Clevers H. Crypt stem cells as the cells-of-origin of intestinal cancer. Nature. 2009;457:608–611. - PubMed
    1. Bensaad K., Vousden K.H. p53: new roles in metabolism. Trends Cell Biol. 2007;17:286–291. - PubMed

Publication types

MeSH terms