. 2013:3:1938.
doi: 10.1038/srep01938.

Metabolic scaling in solid tumours

Affiliations

Metabolic scaling in solid tumours

E Milotti et al. Sci Rep. 2013.

Abstract

Tumour metabolism is an outstanding topic of cancer research, as it determines the growth rate and the global activity of tumours. Recently, by combining the diffusion of oxygen, nutrients, and metabolites in the extracellular environment, and the internal motions that mix live and dead cells, we derived a growth law of solid tumours which is linked to parameters at the cellular level. Here we use this growth law to obtain a metabolic scaling law for solid tumours, which is obeyed by tumours of different histotypes both in vitro and in vivo, and we display its relation with the fractal dimension of the distribution of live cells in the tumour mass. The scaling behaviour is related to measurable parameters, with potential applications in the clinical practice.


Figures

Figure 1
Figure 1. Plot of the normalized nutrient consumption rate (μm3) vs. tumour volume V (μm3), as given by Eq. (4) (solid line).
Here we assume a spherical shape and λ = 100 μm, which is close to the values found in experimental tumour spheroids. The dotted line is the normalized rate formula image 
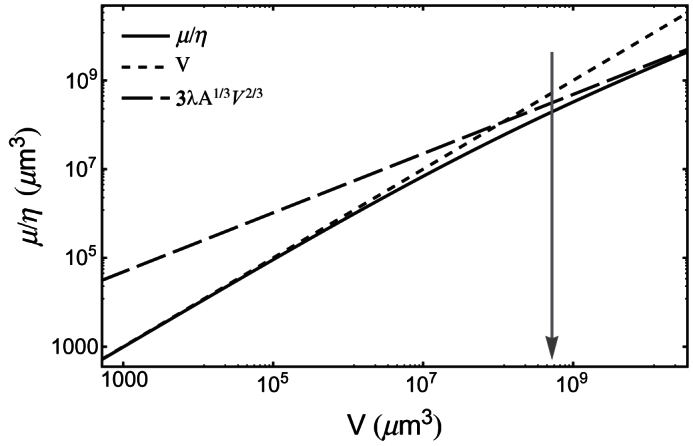
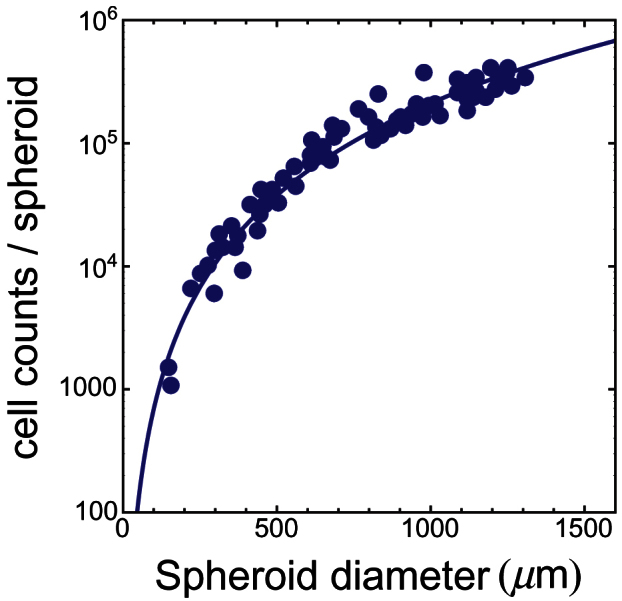
from Eq. (5), while the dashed line is formula image from Eq. (6). The volume range corresponds to a minimum radius of 5 μm (i.e., approximately a single cell), up to a maximum of 2000 μm. The arrow marks the volume corresponding to a nearly spherical avascular tumour with a diameter of 1 mm.
Figure 2
Figure 2. Doubly normalized glucose consumption rate vs. z (z = V/A).
Here we take glucose as representative of all nutrients (see Methods). The black line is a single fit of Eq. (8) to all data shown in the figure: the fit yields λ = 102 ± 2 μm, and it is compatible with the values found in the analysis of growth curves of tumour spheroids. The dotted line is the linear approximation formula image
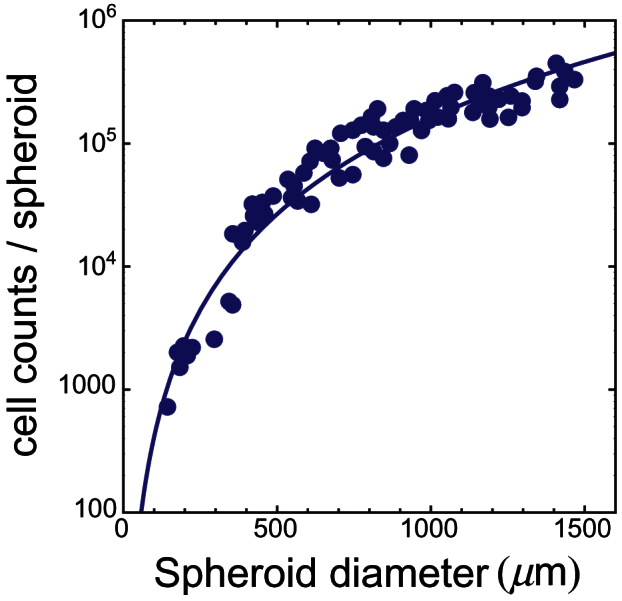
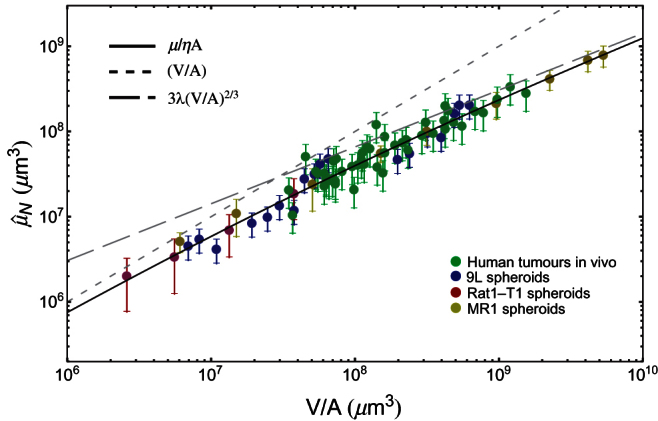
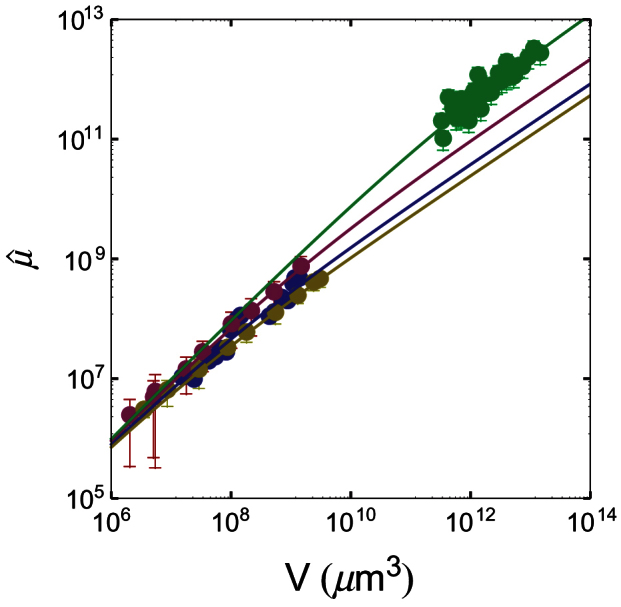
, Eq. (5), at small tumour size, while the dashed line is the approximation formula image, Eq. (6), at large tumour size. Data from human tumours (green circles) include breast, uterine and ovarian carcinomas, melanomas, thyroid carcinomas, colon and lung carcinomas.
Figure 3
Figure 3. Effective fractal dimension of the set of viable cells vs. tumour characteristic size x (μm), assuming λ = 100 μm.
The set of viable cells becomes surface-like as the tumour grows. Therefore nearly all activity is eventually confined to a thin layer between the bulk of the tumour and the nourishing medium (when in vitro), or between bulk and blood vessels (in vivo).
Figure 4
Figure 4. Schematic illustration of a vascularized tumour (not to scale).
Live cells (LC) are distributed along the tumour vasculature (TV) itself and on the tumour boundary where it is close to blood vessels in the normal tissue (NT; blood vessels in normal tissue are not shown). The value of A is determined by the interface between the bulk of the tumour and the non-cancerous environment, and this includes the interface with tumour blood vessels. Areas of tumour quiescence/necrosis (N) are also shown.
Figure 5
Figure 5. Number of live Rat1-T1 cells per spheroid as the function of spheroid diameter.
Symbols refer to experimental data from Fig. 2 in ref. . The line is the best fit with a power-law function (see text). The fit returns the following estimates for parameters: formula image and formula image.
Figure 6
Figure 6. Number of live MR1 cells per spheroid as the function of spheroid diameter.
Symbols refer to experimental data from Fig. 2 in ref. . The line is the best fit with a power-law function (see text). The fit returns the following estimates for parameters: formula image and formula image.
Figure 7
Figure 7. Nonlinear fits of the four data-sets with Eq. (7): symbols, experimental data; lines, nonlinear fit.
The colours of both symbols and lines refer to different experimental data-sets and are as follows: blue, 9L spheroids; red, Rat1-T1 spheroids; yellow, MR1 spheroids; green, human tumours.

References

    1. Milotti E., Vyshemirsky V., Sega M. & Chignola R. Interplay between distribution of live cells and growth dynamics of solid tumours,. Sci. Rep. 2, 990, 10.1038/srep00990 (2012). - PMC - PubMed
    1. Milotti E. & Chignola R. Emergent properties of tumor microenvironment in a real-life model of multicell tumor spheroids. PLoS ONE 5, e13942, 10.1371/journal.pone.0013942 (2010). - PMC - PubMed
    1. Helmlinger G., Yuan F., Dellan M. & Jain R. K. Interstitial pH and pO2 gradients in solid tumors in vivo: high resolution measurements reveal al lack of correlation. Nat. Med. 3, 177–182 (1997). - PubMed
    1. Tannock I. F. The relation between cell proliferation and the vascular system in a transplanted mouse mammary tumour. Br. J. Cancer 22, 258–273 (1968). - PMC - PubMed
    1. Li C. K. N. The glucose distribution in 9L rat brain multicell tumour spheroids and its effect on cell necrosis. Cancer 50, 2066–2073 (1982). - PubMed

Publication types

LinkOut - more resources