. 2013 Jul;19(7):916-23.
doi: 10.1038/nm.3181. Epub 2013 Jun 2.

Fgf9 from dermal γδ T cells induces hair follicle neogenesis after wounding

Affiliations

Fgf9 from dermal γδ T cells induces hair follicle neogenesis after wounding

Denise Gay et al. Nat Med. 2013 Jul.

Abstract

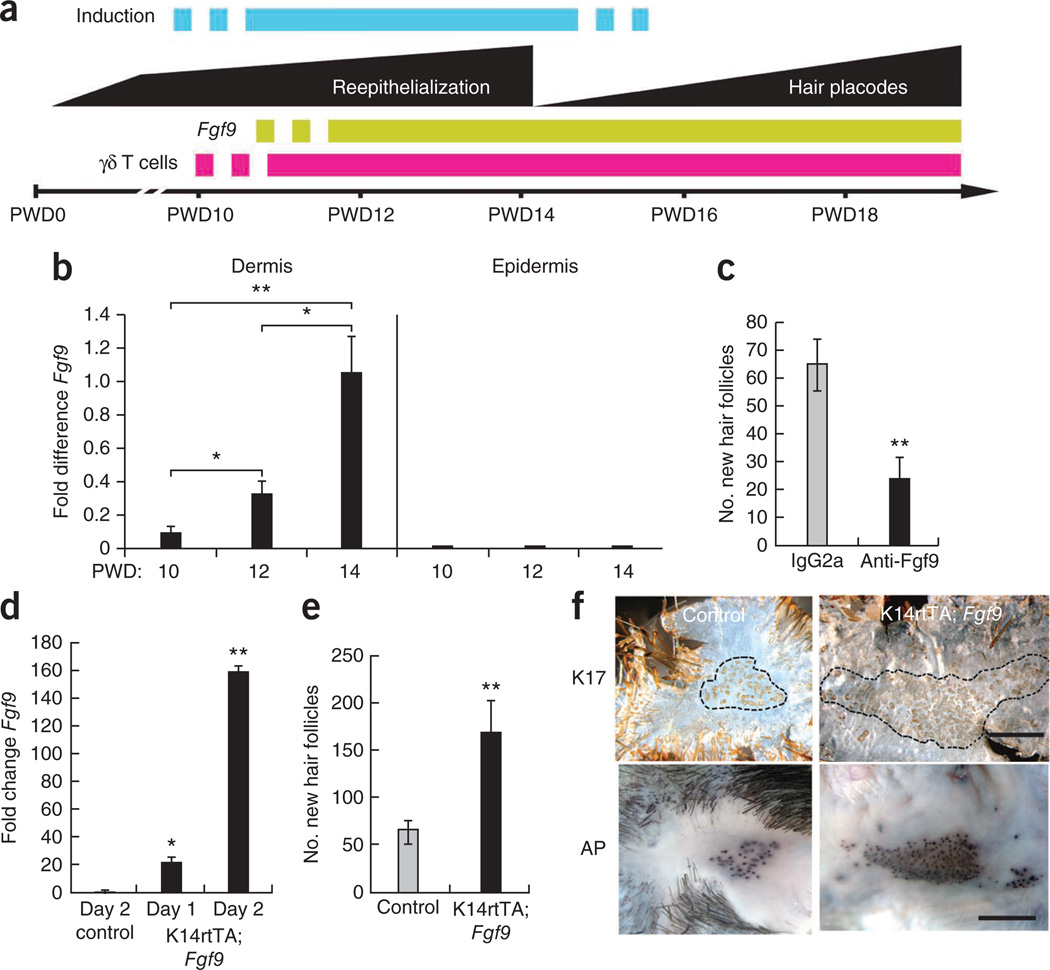
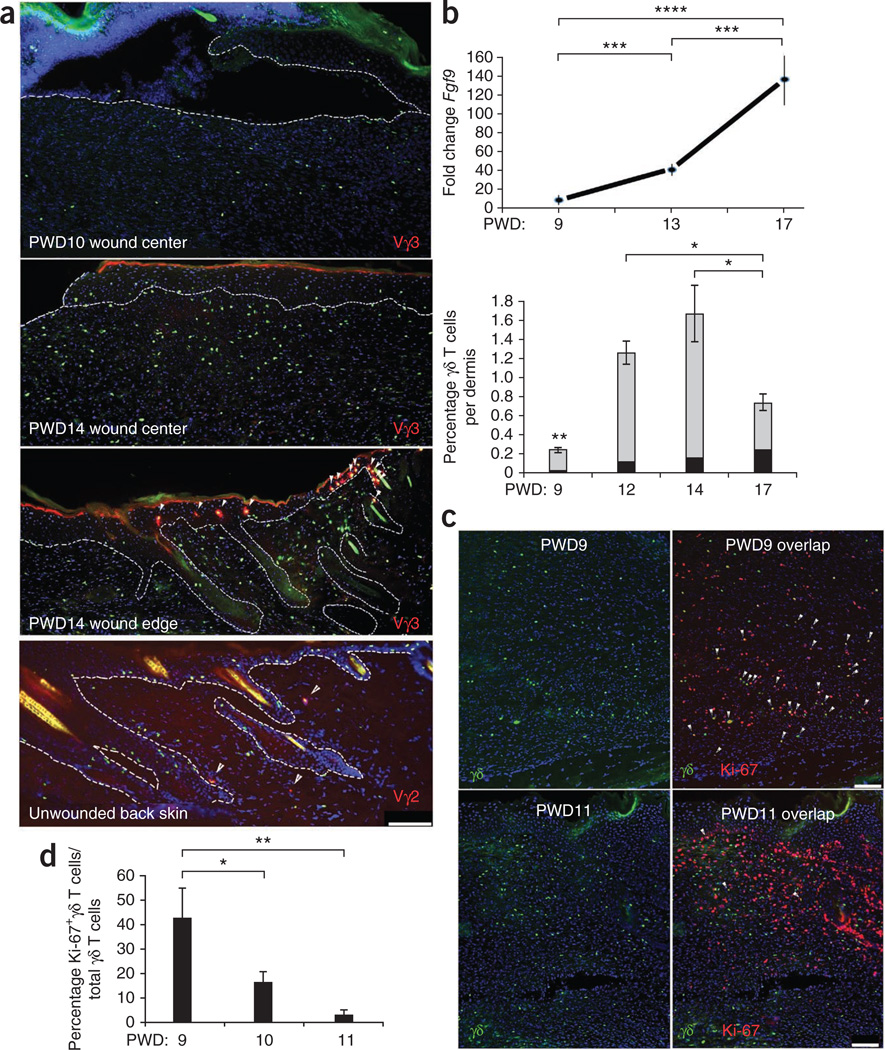
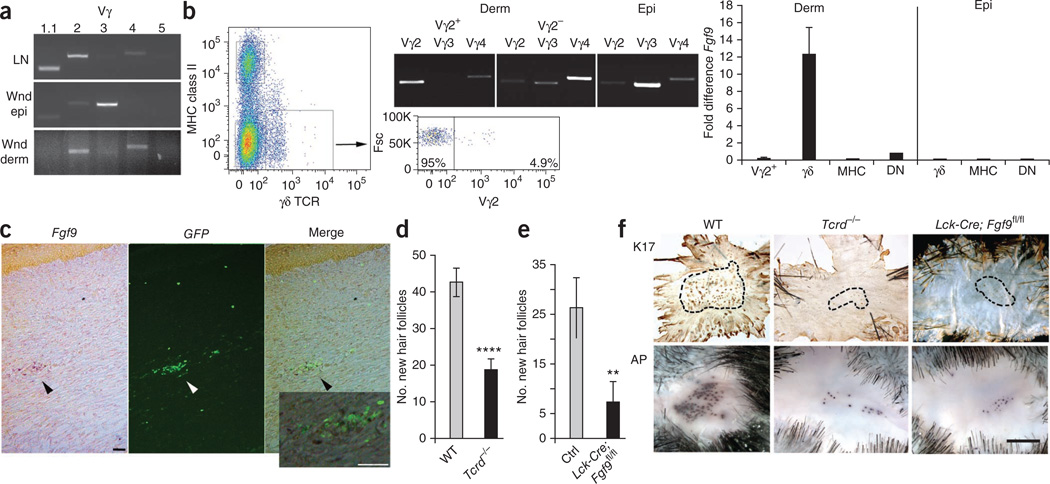
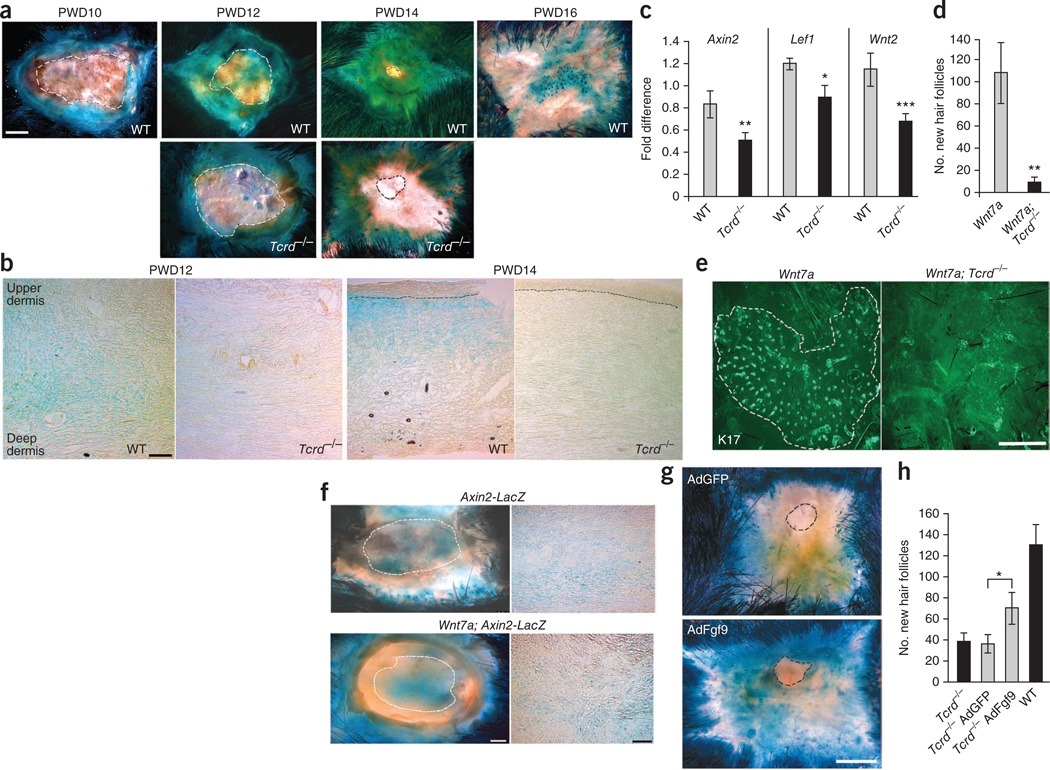
Understanding molecular mechanisms for regeneration of hair follicles provides new opportunities for developing treatments for hair loss and other skin disorders. Here we show that fibroblast growth factor 9 (Fgf9), initially secreted by γδ T cells, modulates hair follicle regeneration after wounding the skin of adult mice. Reducing Fgf9 expression decreases this wound-induced hair neogenesis (WIHN). Conversely, overexpression of Fgf9 results in a two- to threefold increase in the number of neogenic hair follicles. We found that Fgf9 from γδ T cells triggers Wnt expression and subsequent Wnt activation in wound fibroblasts. Through a unique feedback mechanism, activated fibroblasts then express Fgf9, thus amplifying Wnt activity throughout the wound dermis during a crucial phase of skin regeneration. Notably, humans lack a robust population of resident dermal γδ T cells, potentially explaining their inability to regenerate hair after wounding. These findings highlight the essential relationship between the immune system and tissue regeneration. The importance of Fgf9 in hair follicle regeneration suggests that it could be used therapeutically in humans.


Figures

Figure 1
Figure 1
Fgf9 expression modulates WIHN. (a) Schematic model showing events in late-stage wound healing of normal mice aged 6–8 weeks. The blue bar specifies a hypothetical window of induction to hair follicle fate. (b) qPCR analyses of Fgf9 expression in wound dermis and epidermis at PWD10–PWD14. cDNAs equalized for expression of the housekeeping gene 18S rRNA were compared for differences in Fgf9 expression levels. n = 4 for each time point. Results are representative of four independent experiments. (c) Number of new hair follicles in wounds of mice treated with anti-Fgf9 (black) or isotype control antibody (gray). Control mice: n = 15; mice treated with anti-Fgf9: n = 16. Data are representative of three independent experiments. (d) qPCR analyses of Fgf9 expression in skin of K14rtTA; Fgf9 mice compared to single-transgene controls (Control) during 2 d of doxycycline treatment. (e) Number of new hair follicles in wounds of K14rtTA; Fgf9 transgenic (black) or control (gray) mice treated with doxycycline from PWD12 to PWD17. Single-transgene control mice: n = 21; K14rtTA; Fgf9 transgenic mice: n = 12. Data are combined results from five independent experiments. (f) Whole-mount epidermal (top) or dermal (bottom) preparations of reepithelialized wounds stained for keratin 17 (K17, top) or alkaline phosphatase activity (AP, bottom). Black dashed line borders regions of new hair placodes. Scale bars, 1 mm. Data are expressed as means ± s.e.m. *P < 0.05, **P < 0.01 for panels be.
Figure 2
Figure 2
Kinetics of γδ T cell density and Fgf9 expression in wound dermis during late healing and in unwounded skin. (a) Immunofluorescence (IF) analyses of wounded and unwounded Tcrd-H2BEGFP skin frozen sections stained with antibodies to detect Vγ3+ dendritic epidermal T cells (red) in wound center (top, middle) and wound edge (second from bottom, arrowheads) at PWD10 or PWD14 as indicated or Vγ2+ T cells in unwounded skin (bottom, arrowheads). Green nuclei denote γδ T cells. DAPI staining (blue) shows the locations of all nuclei. Dashed lines represent the junction between epidermis and dermis. Scale bar, 100 µm. Vγ2+GFP+ cells in multiple sections indicated that they represent approximately 28% of dermal γδ T cells in unwounded back skin (data not shown). n = 8. Results are representative of four independent experiments. (b) qPCR analyses of Fgf9 expression (top) compared with percentage of γδ T cells (bottom, gray) and percentage of Vγ2+ γδ T cells (black) per C57BL/6 wound dermis from PWD9 to PWD17 as determined by FACS. n = 20 for each time point. (c) IF analyses showing γδ T cells (left) and Ki-67+ γδ T cells (right, arrowheads) within PWD9 (top) and PWD11 (bottom) Tcrd-H2BEGFP wounds. Scale bar, 100 µm. (d) Percentage of Ki-67+ γδ T cells per total number γδ T cells as counted in sequential frozen sections of Ki-67–specific antibody–stained Tcrd-H2BEGFP PWD9–PWD11 wounds. n = 6–20 for each time point. Results are representative of four independent experiments. Data are expressed as means ± s.e.m. *P < 0.05, **P < 0.01, ***P < 0.005, ****P < 0.001 for b (γδ T cells only) and d.
Figure 3
Figure 3
Fgf9, secreted by wound dermal γδ T cells, is an important component of WIHN. (a) RT-PCR analyses of lymph node cells (LN), wound epidermis (Wnd epi) and wound dermis (Wnd derm) for rearranged Vγ variable regions Vγ1.1, Vγ2, Vγ3, Vγ4 and Vγ5 (n = 4). Results are representative of three independent experiments. (b) Left, pseudocolor density dot plot of PWD12 dermal cells sorted for expression of MHC class II and γδ TCR. The lower boxed population represents cells that were further sorted for Vγ2 expression (right dot plot) and forward scatter (Fsc). Middle, RT-PCR analysis of sorted Vγ2+ and Vγ2 populations from dermis (Derm) and sorted γδ T cells from wound epidermis (Epi) for Vγ2, Vγ3 and Vγ4 to determine purity of each population. Right, qPCR analyses of sorted Vγ2+ γδ T cells (Vγ2+), all other γδ T cells (γδ), MHC class II+ cells (MHC) and nonstaining double-negative cells (DN) in wound dermis (left) or γδ, MHC and double-negative cells in wound epidermis (right) for Fgf9 expression. For these experiments, wound dermis or epidermis from 20–40 mice was combined and sorted. Results are representative of three independent experiments. (c) In situ hybridization for Fgf9 expression in a Tcrd-H2BEGFP wound frozen section. Left image (Fgf9) shows in situ hybridization for Fgf9 expression in a PWD11 frozen section. Dark purple dots (black arrowhead) represent Fgf9+ cells in the dermis. Middle image (GFP) shows location of GFP-expressing γδ T cells (white arrowhead) within the same section. Right image (Merge) shows overlap of left and middle images. Scale bar, 75 µm. The inset represents a magnified view of the region indicated by the black arrowhead in right image. Scale bar, 75 µm (n = 12). Results are representative of four independent experiments. Probe specificity is illustrated in Supplementary Figure 7b. (d) Number of new hair follicles in wounds of WT control and Tcrd−/− mice. WT mice: n = 37; Tcrd−/− mice: n = 50. Data represent combined results of eight independent experiments. (e) Number of new hair follicles in wounds of Lck-Cre; Fgf9fl/fl and control (Ctrl) mice. Lck-Cre; Fgf9fl/fl mice: n = 17; single-transgene control mice: n = 30. Data represent combined results of seven independent experiments. (f) Representative whole-mount preparations of wound epidermis from WT, Tcrd−/− and Lck-Cre; Fgf9fl/fl mice stained for Keratin 17 (K17) and dermis stained for alkaline phosphatase activity (AP). Black dashed lines represent borders of areas with new hair placodes. Scale bar, 1 mm. Data are expressed as means ± s.e.m. **P < 0.01, ****P < 0.001 compared to controls, calculated using two-tailed Student’s t test.
Figure 4
Figure 4
Late-stage wounds of Tcrd−/− mice showed reduced dermal Wnt activity. (a,b) Whole mounts (a) and frozen sections (b) of skin from Axin2-LacZ (WT) and Axin2-LacZ; Tcrd−/− (Tcrd−/−) mice at the indicated times after wounding assayed for β-galactosidase activity (blue). Dashed lines in a denote the edge of the epithelial tongue in whole mounts. Scale bar, 1 mm. Black dashed lines in b represent epidermal-dermal junction in PWD14 comparisons. Scale bar, 100 µm. Single-transgene control mice: n = 8 (PWD10), n = 22 (PWD12), n =12 (PWD14), n = 6 (PWD16); Axin2-LacZ; Tcrd−/− mice: n= 14 (PWD12), n = 7 (PWD14). Data are representative of six independent experiments. (c) Relative expression of Axin2, Lef1 and Wnt2 in wound dermis of C57BL/6 (WT) and Tcrd−/− mice as determined by qPCR. WT mice: n = 12; Tcrd−/− mice: n = 12. Data are representative of three independent experiments. (d) Number of new hair follicles in wounds of Krt14-Wnt7a (Wnt7a) and Krt14-Wnt7a; Tcrd−/− (Wnt7a; Tcrd−/−) mice. Wnt7a mice: n = 9; Wnt7a; Tcrd−/− mice: n = 20. Data are combined results from four independent experiments. (e) Representative whole-mount preparations of wound epidermis from Krt14-Wnt7a (Wnt7a) and Krt14-Wnt7a; Tcrd−/− (Wnt7a; Tcrd−/−) mice immunostained for K17. The white dashed line in the left image represents the border of new hair placodes. Scale bar, 0.5 mm. (f) Whole mounts (left) and frozen sections (right) from wounds of Axin2-LacZ (top) and K14-Wnt7a; Axin2-LacZ (Wnt7a; Axin2-LacZ, bottom) mice assayed for β-galactosidase activity at PWD12. Left; white dashed line denotes the edge of the epithelial tongue. Scale bar, 1 mm. Right; scale bar, 100 µm (n = 4). Results are representative of three independent experiments. (g) Representative whole-mount preparations from wounds of Axin2-LacZ; Tcrd−/− mice injected with AdGFP (top) or AdFgf9 (bottom) at PWD9 and assayed for β-galactosidase activity at PWD12. The dashed lines denote the edge of the epithelial tongue. Scale bar, 1 mm. (h) Number of new hair follicles in untreated wounds of Axin2-LacZ; Tcrd−/− (far left, black) and Axin2-LacZ WT (far right, black) mice or wounds of AdGFP-injected (left, gray) and AdFgf9-injected (right, gray) Axin2-LacZ; Tcrd−/− mice. Untreated Axin2-LacZ; Tcrd−/− mice: n = 12; untreated Axin2-LacZ WT mice: n = 18; AdGFP-treated mice: n = 25; AdFgf9-treated mice: n = 25. Data are representative of seven independent experiments. Data are expressed as means ± s.e.m. *P < 0.05, **P < 0.01, ***P < 0.005.
Figure 5
Figure 5
Fgf9 secreted from γδ T cells induces a feedback loop resulting in widespread wound dermal Wnt activation. (a) qPCR analyses of Wnt2 (black) and Wnt10a (gray) expression in C57BL/6 (WT) or Tcrd−/− wound fibroblasts cultured with the indicated concentrations of recombinant Fgf9 protein. Samples were normalized to equivalent 18S rRNA levels and transcript levels of Wnt2 and Wnt10a compared to that normalized value. Results are representative of three independent experiments. (b) qPCR analyses of Wnt2 and Fgf9 expression in sorted WT and Tcrd−/− fibroblasts taken directly from PWD10, PWD12 and PWD14 wounds. Wound dermis from ten mice was combined and cells sorted for each experiment. Results are representative of three independent experiments. (c) qPCR analyses of Fgf9 expression in C57BL/6 γδ T cells and fibroblasts sorted from PWD10, PWD11, PWD12 and PWD14 wounds. For each time point, wound dermis from 10–15 mice was combined and sorted. Results represent three independent experiments. *P < 0.05. (d) ELISA analyses of secreted Fgf9 protein from wound fibroblasts of Axin2-LacZ mice, cultured with the indicated concentrations of recombinant Wnt2a protein for 24 h, 48 h and 72 h. Results are representative of three independent experiments. (e) Model depicting Fgf9-driven Wnt activation feedback loop. Boxed region in the bottom image (inset) shows the dermal location of fibroblasts undergoing Fgf9 activation and Wnt2a expression (top left), Wnt activation (top middle) and new Fgf9 expression (top right). Data are expressed as means ± s.e.m.
Figure 6
Figure 6
Humans lack a robust population of resident dermal γδ T cells. (a) Representative FACS dot plots of γδ T cells in C57BL/6 mouse dermis (left), human dermis (middle) and human blood lymphocytes (human PBL, right) as determined by staining with antibodies to CD3 and T cell antigen receptor δ chain (TCR-δ). (b) Percentages of CD3+γδ cells (CD3) and γδ T cells in mouse and human dermis as determined by FACS (as defined in a) and IF analyses (see Online Methods). For FACS analyses, human skin samples: n = 7; C57BL/6 mice: n = 16. For IF analyses, human skin samples: n = 4 (five or six sections per individual); Tcrd-H2BEGFP mice: n = 16 (three or four sections per mouse). Data are representative of three independent experiments. (c) Mouse and human γδ T cell density per mm2 dermis area. Human and mouse γδ T cell numbers (as defined in b, IF analyses) per total dermal surface area in each tissue section, normalized to 1 mm2. (d) IF analyses of Tcrd-H2BEGFP mouse (top) and human (bottom) skin frozen sections showing locations of CD3+ T cells and γδ T cells (arrowheads). DAPI-stained nuclei are blue. Dashed lines represent dermal-epidermal junction. Scale bars, 75 µm. (e) IF analyses of Tcrd-H2BEGFP mouse (top) and human (bottom) skin locations of γδ T cells (green, top), CD3+ T cells (red, bottom) relative to CD31+ blood vessels. Dashed lines represent dermal-epidermal junction. Scale bars, 75 µm. (f) IF analyses of human skin γδ T cells (green, left), all CD3+ T cells (red, middle) and merged image (right, arrowheads point to γδ T cells). Dashed white line represents dermal-epidermal junction. Scale bar, 25 µm. For panels b and c, data are expressed as means ± s.e.m. *P < 0.05, ****P < 0.001 compared to controls, calculated using two-tailed Student’s t test.

References

    1. Ito M, et al. Wnt-dependent de novo hair follicle regeneration in adult mouse skin after wounding. Nature. 2007;447:316–320. - PubMed
    1. Breedis C. Regeneration of hair follicles and sebaceous glands from the epithelium of scars in the rabbit. Cancer Res. 1954;14:575–579. - PubMed
    1. Gurtner GC, Werner S, Barrandon Y, Longaker MT. Wound repair and regeneration. Nature. 2008;453:314–321. - PubMed
    1. Jameson J, et al. A role for skin γδ T cells in wound repair. Science. 2002;296:747–749. - PubMed
    1. Sharp LL, Jameson JM, Cauvi G, Havran WL. Dendritic epidermal T cells regulate skin homeostasis through local production of insulin-like growth factor 1. Nat. Immunol. 2005;6:73–79. - PubMed

Publication types

MeSH terms