. 2013 Jun;123(6):2672-84.
doi: 10.1172/JCI67294.

Persistent G. lamblia impairs growth in a murine malnutrition model

Affiliations

Persistent G. lamblia impairs growth in a murine malnutrition model

Luther A Bartelt et al. J Clin Invest. 2013 Jun.

Abstract

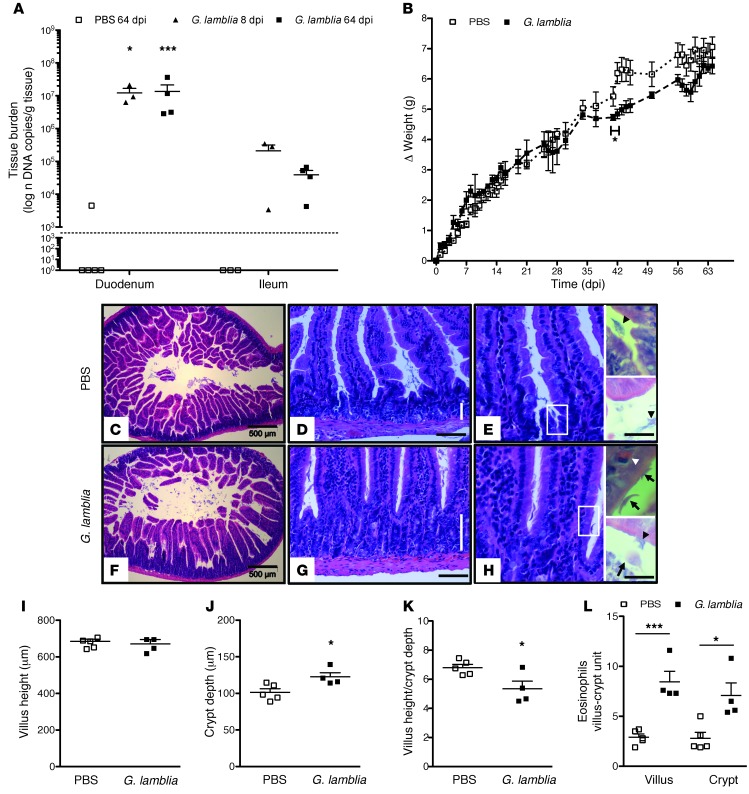
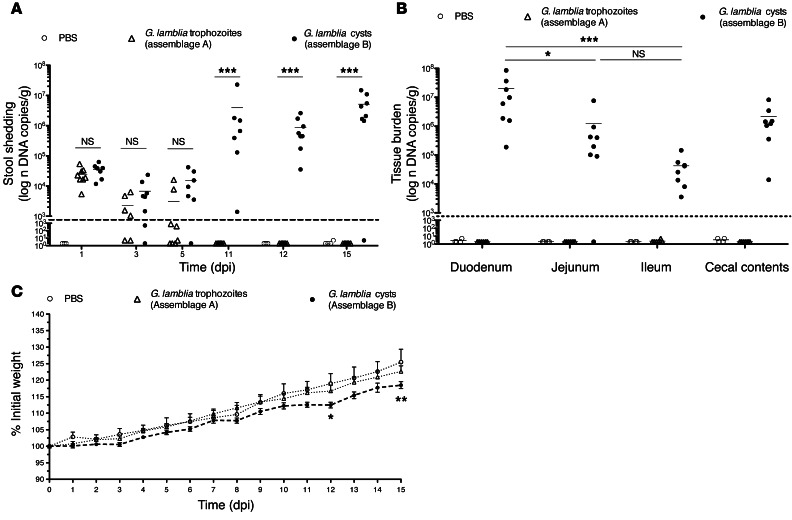
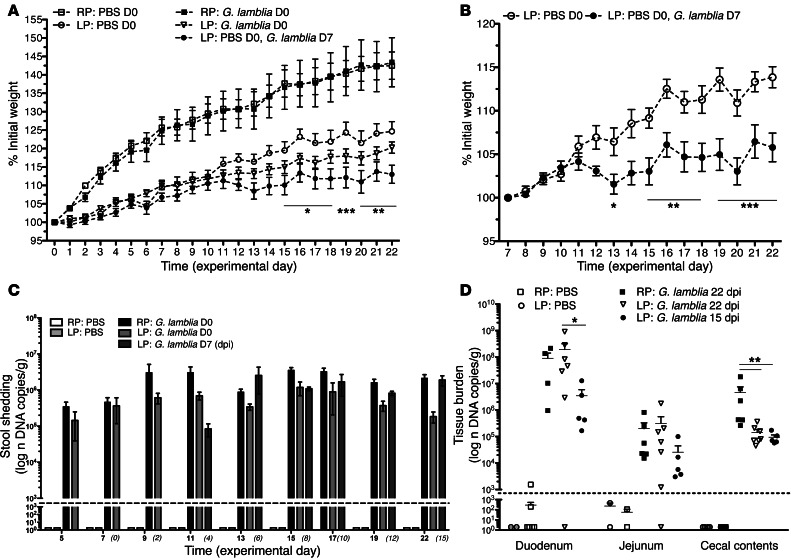
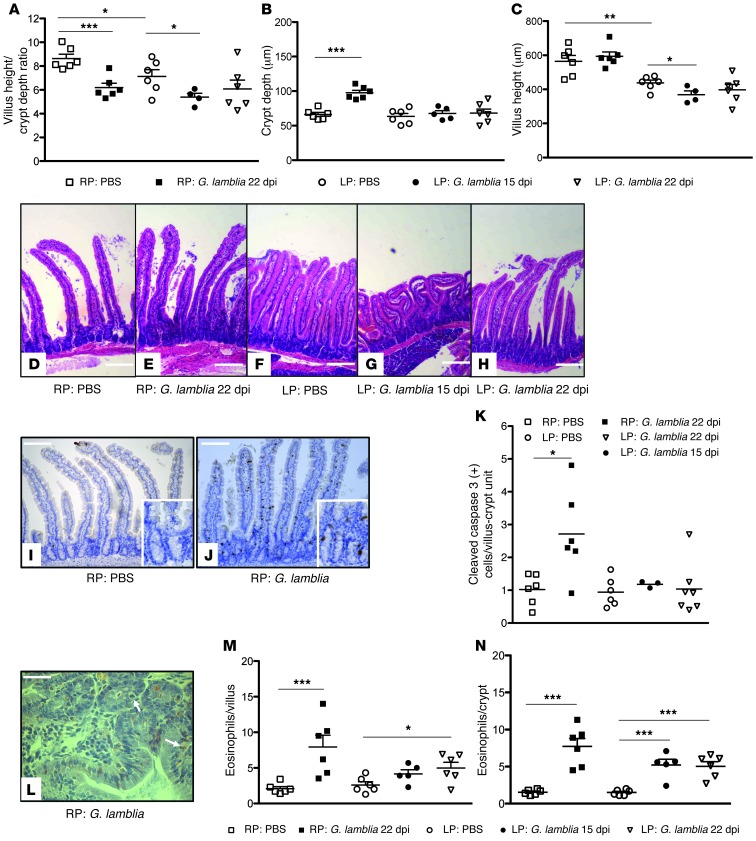
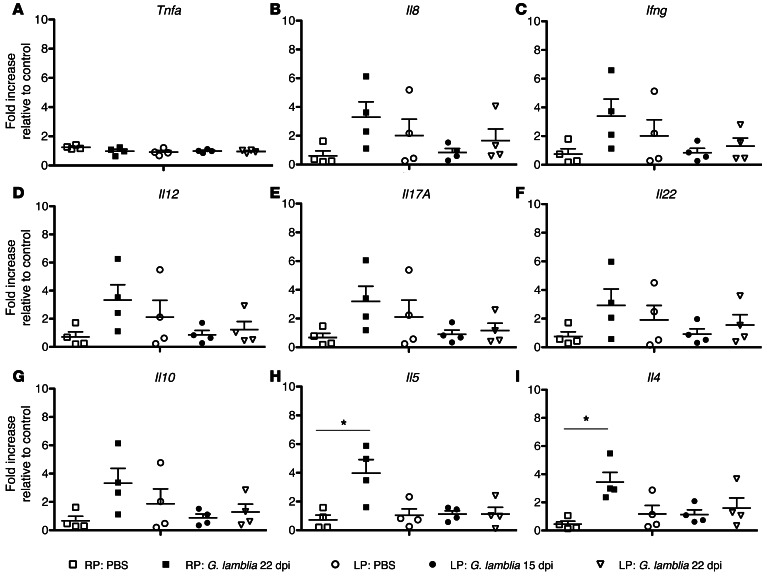
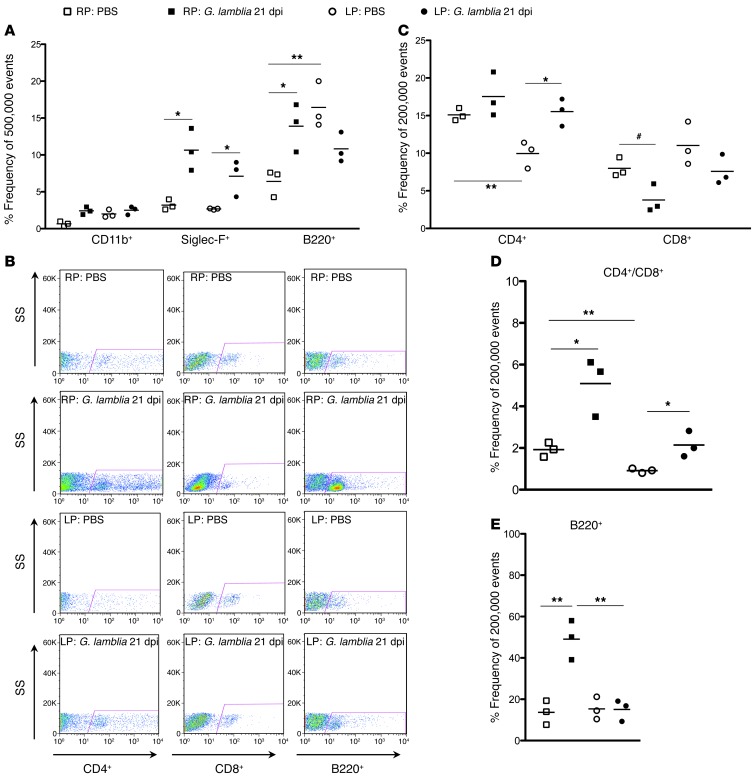
Giardia lamblia infections are nearly universal among children in low-income countries and are syndemic with the triumvirate of malnutrition, diarrhea, and developmental growth delays. Amidst the morass of early childhood enteropathogen exposures in these populations, G. lamblia–specific associations with persistent diarrhea, cognitive deficits, stunting, and nutrient deficiencies have demonstrated conflicting results, placing endemic pediatric giardiasis in a state of equipoise. Many infections in endemic settings appear to be asymptomatic/ subclinical, further contributing to uncertainty regarding a causal link between G. lamblia infection and developmental delay. We used G. lamblia H3 cyst infection in a weaned mouse model of malnutrition to demonstrate that persistent giardiasis leads to epithelial cell apoptosis and crypt hyperplasia. Infection was associated with a Th2-biased inflammatory response and impaired growth. Malnutrition accentuated the severity of these growth decrements. Faltering malnourished mice exhibited impaired compensatory responses following infection and demonstrated an absence of crypt hyperplasia and subsequently blunted villus architecture. Concomitantly, severe malnutrition prevented increases in B220+ cells in the lamina propria as well as mucosal Il4 and Il5 mRNA in response to infection. These findings add insight into the potential role of G. lamblia as a "stunting" pathogen and suggest that, similarly, malnourished children may be at increased risk of G. lamblia– potentiated growth decrements.


Figures

Figure 1
Figure 1. Persistent G. lamblia infection in nourished mice is associated with impaired growth, eosinophil infiltration, and crypt hyperplasia.
(A) G. lamblia tissue burden determined by qPCR in duodenum compared with ileum at 8 and 64 dpi (n = 3–5 per group). The dashed line represents the PCR limit of detection. *P = 0.029; ***P = 0.001. (B) Growth curves measuring the change in weight after challenge with PBS (n = 5) or 106 G. lamblia (n = 4) as indicated (*P < 0.05, day 42). (CE) Representative H&E-stained duodenum sections of a single PBS-challenged mouse at 64 days after challenge. Vertical bar represents crypt depth (D). Black arrowhead represents mucus. Scale bars: 500 (C), 100 (D), and 50 microns (E) (inset, 20 microns). (FH) Representative H&E-stained duodenum sections of a single G. lamblia–infected mouse at 64 dpi. Vertical bar represents crypt depth (G). Scale bars: 500 (C), 100 (D), and 50 microns (E). (H) Representative H&E-stained duodenum section at 64 days after challenge with G. lamblia showing hypercellularity in the crypts and villus base. Arrows indicate G. lamblia in ventral (lower right) and transverse (upper right) orientations, white arrowhead represents an intraepithelial eosinophil, and black arrowhead represents mucus. Scale bar: 50 microns (inset, 20 microns). (IK) Mucosal morphometric changes at 64 dpi measured on H&E-stained duodenum sections. Original magnification, ×10. (J) *P = 0.027; (K) *P = 0.029. (L) Enumeration of eosinophils on ×20 H&E-stained duodenum sections in PBS-challenged and G. lamblia–challenged mice at 64 dpi. *P = 0.013; ***P < 0.001.
Figure 2
Figure 2. Challenge with G. lamblia H3 cysts in malnourished mice is persistent and is associated with early growth faltering.
(A) G. lamblia serial stool shedding determined by qPCR on indicated dpi (***P < 0.001) and (B) in small bowel intestinal tissues at 15 dpi (*P < 0.04 and ***P < 0.001 vs. duodenum). Dashed line represents the limit of detection on both graphs. (C) Growth curves measuring the percentage of change in weight beginning on the day of infection with G. lamblia H3 cysts (n = 8), G. lamblia WB trophozoites (n = 8), or PBS control (n = 3; original PBS control was n = 4, but 1 mouse was excluded secondary to significant gavage trauma and >20% weight loss by day 4). *P = 0.05, 12 dpi; **P < 0.01, 15 dpi; H3 cysts versus PBS.
Figure 3
Figure 3. G. lamblia–associated growth faltering is accentuated with more prolonged malnutrition.
(A) Growth curves measuring the percentage of initial weight following a 20% protein diet (RP) or a 2% protein diet (LP). Day 0 is the day of infection with G. lamblia H3 cysts or PBS challenge. One group of mice challenged with PBS on day 0 (D0) was challenged with G. lamblia H3 cysts on day 7 (D 7) (n = 5–7). P < 0.05, RP: PBS vs. LP: PBS; *P < 0.05, **P < 0.01, ***P < 0.001, LP: PBS vs. LP: G. lamblia D7. (B) Growth curves showing percentage of initial weight change beginning 15 days after initiation of an LP diet. Day 7 is the day of infection. *P < 0.05; **P < 0.01; ***P < 0.001. (C) Parasite burden determined by qPCR in serial stool collections on indicated dpi and (D) in representative intestinal tissues 15 dpi (infected on day 7) and 22 dpi (infected on day 0). *P = 0.006; **P < 0.001. Dashed line represents the limit of detection on both graphs.
Figure 4
Figure 4. Malnutrition diminishes apoptosis, crypt hyperplasia, and eosinophil responses to G. lamblia infection.
(AC) Villus and crypt architectural changes following G. lamblia infection in RP- and LP-fed mice at indicated time points after infection (n = 4–7 mice per group). Bar caps designate comparisons. *P < 0.05; **P < 0.01; ***P < 0.001 for all graphs. (DH) Representative H&E-stained sections of a single mouse from each group as indicated. Images were selected to best represent the average morphometry in each group. Scale bars: 500 microns. (I and J) Cleaved caspase-3 immunohistochemistry staining as indicated. Scale bars: 200 microns (inset, 100 microns) (K) Number of cells positive for cleaved caspase-3 staining per villus-crypt unit. Original magnification, ×20. *P = 0.015. Representative cleaved caspase-3 immunohistochemically stained intestinal sections as indicated. (L) Congo red stain demonstrating eosinophils within the epithelium of G. lamblia–infected RP-fed mouse. (M and N) Enumeration of eosinophils on H&E staining at ×20 and ×40 magnification per villus or crypt as indicated. Bar caps designate comparisons. *P = 0.026; **P < 0.01; ***P < 0.001.
Figure 5
Figure 5. G. lamblia is associated with significantly elevated tissue expression of Il4 and Il5 mRNA at 22 dpi, and malnutrition blunts this response.
Fold change increase in duodenal cytokine mRNA expression normalized to the geometric mean of beta-actin and HPRT relative to controls (RP: PBS) for (A) Tnfa, (B) Il8 (CXCR1/KC), (C) Ifng, (D) Il12, (E) Il17a, (F) Il22, (G) Il10, (H) Il5, and (I) Il4. *P < 0.05.
Figure 6
Figure 6. Both G. lamblia and malnutrition alter the relative frequencies among lymphocyte populations in the lamina propria, and G. lamblia increases eosinophils and B cells in the epithelium.
Flow cytometry of epithelium and lamina propria fractions taken 22 dpi with 106 G. lamblia H3 cysts. (A) Epithelial fraction, *P < 0.05, **P = 0.009. (B) Representative flow cytometry of lamina propria lymphocytes (LPLs) as side scatter (SS) versus CD4+, CD8+, or B220+ as designated. (C) LPL T cell population frequencies as designated. *P = 0.019; **P < 0.011; #P < 0.033. (D) LPL CD4+/CD8+ ratios. *P < 0.05; **P = 0.008. (E) LPL B cell (B220+) frequencies. **P = 0.005.

Comment in

References

    1. Ali SA, Hill DR. Giardia intestinalis. Curr Opin Infect Dis. 2003;16(5):453–460. doi: 10.1097/00001432-200310000-00012. - DOI - PubMed
    1. Savioli L, Smith H, Thompson A. Giardia and Cryptosporidium join the ‘Neglected Diseases Initiative’. Trends Parasitol. 2006;22(5):203–208. doi: 10.1016/j.pt.2006.02.015. - DOI - PubMed
    1. Mondal D, et al. Contribution of enteric infection, altered intestinal barrier function, and maternal malnutrition to infant malnutrition in Bangladesh. Clin Infect Dis. 2012;54(2):185–192. doi: 10.1093/cid/cir807. - DOI - PMC - PubMed
    1. Hill DR, Nash TE. Principles and Practices of Infectious Diseases. 2009. Giardia lamblia. In: Mandell GL, Bennett JE, Dolin R, eds. pp. 3527–3534. 5th ed. Philadelphia, Pennsylvania, USA: Churchill Livngstone Elsevier;
    1. Newman RD, Moore SR, Lima AA, Nataro JP, Guerrant RL, Sears CL. A longitudinal study of Giardia lamblia infection in north-east Brazilian children. . Trop Med Int Health. 2001;6(8):624–634. doi: 10.1046/j.1365-3156.2001.00757.x. - DOI - PubMed

Publication types

MeSH terms