. 2013 Jul;20(7):876-83.
doi: 10.1038/nsmb.2595. Epub 2013 Jun 2.

The glucocorticoid receptor dimer interface allosterically transmits sequence-specific DNA signals

Affiliations

The glucocorticoid receptor dimer interface allosterically transmits sequence-specific DNA signals

Lisa C Watson et al. Nat Struct Mol Biol. 2013 Jul.

Abstract

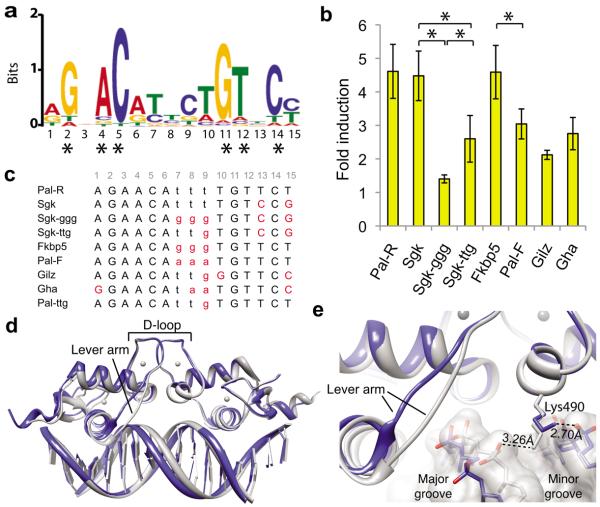
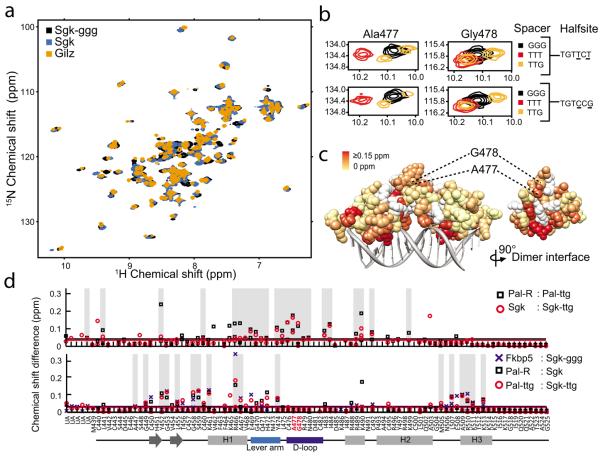
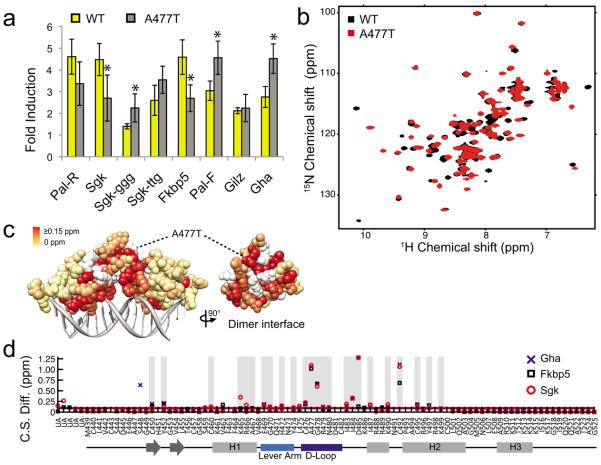
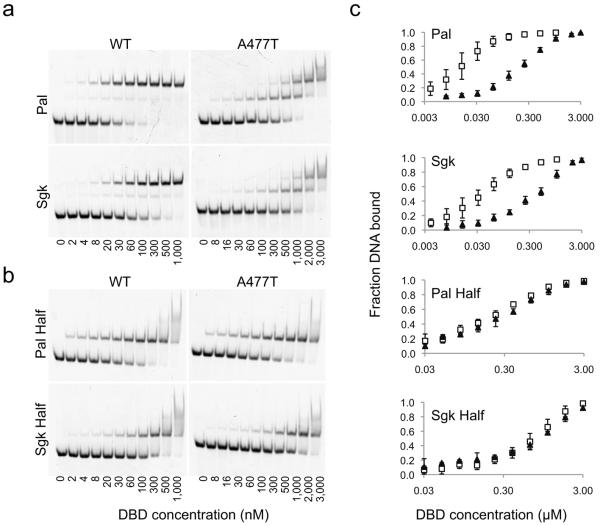
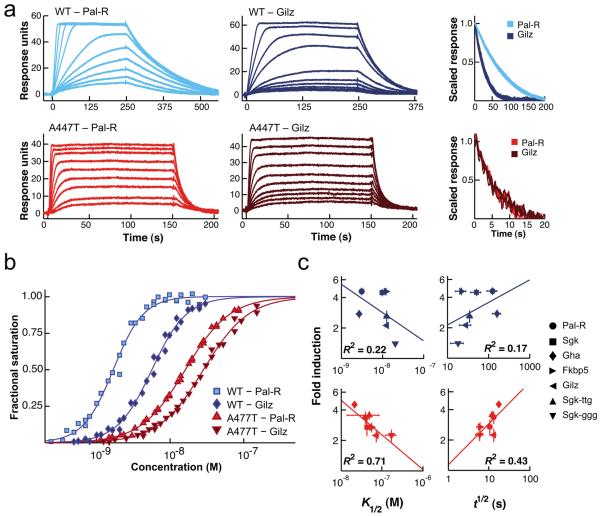
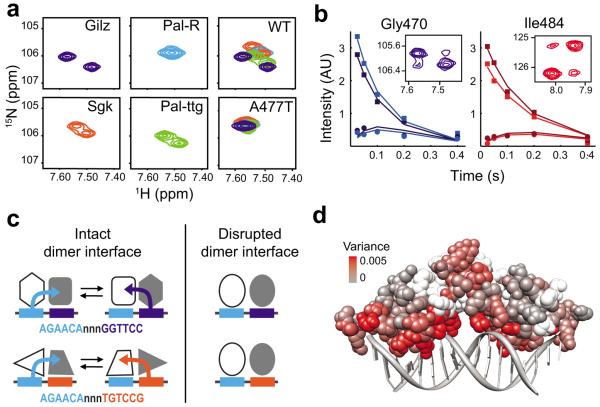
Glucocorticoid receptor (GR) binds to genomic response elements and regulates gene transcription with cell and gene specificity. Within a response element, the precise sequence to which the receptor binds has been implicated in directing its structure and activity. Here, we use NMR chemical-shift difference mapping to show that nonspecific interactions with bases at particular positions in the binding sequence, such as those of the 'spacer', affect the conformation of distinct regions of the rat GR DNA-binding domain. These regions include the DNA-binding surface, the 'lever arm' and the dimerization interface, suggesting an allosteric pathway that signals between the DNA-binding sequence and the associated dimer partner. Disrupting this pathway by mutating the dimer interface alters sequence-specific conformations, DNA-binding kinetics and transcriptional activity. Our study demonstrates that GR dimer partners collaborate to read DNA shape and to direct sequence-specific gene activity.


Figures

Figure 1
Figure 1
Non-specific GBS bases modulate GR structure and activity. (a) The GR binding motif identified by GR ChIP-sequencing in U2OS-GR cells using MEME in “zero or one motif per site” mode with a 2nd order background Markov Model based on the top 1,000 peaks. Asterisks indicate specific-bases that are directly contacted by GR. (b) Luciferase induction of single GBS reporters with 100 nM dexamethsone (dex) treatment compared to ethanol control in U2OS cells. Error is s.d. of four or more independent experiments. Significant difference in transcriptional response by 2-tailed t-Test (*p < 0.05) is indicated for GBSs that differ only by spacer. (c) List of the GBS sequences used in this study with spacer (lowercase) and bases that differ from the palindromic Pal-R sequence (red). The 15-bp GBSs were centered within identical flanking sequences resulting in a 24-bp double-stranded DNA. (d) Alignment of GR DBD – Pal-F (PDB ID: 3g99, grey) and GR DBD – Fkbp5 (PDB ID: 3g6u, blue) crystal structures. (e) Zoomed view of Lys490 interaction with the GBS spacer of the Pal-F GBS (grey) and the Fkbp5 GBS (blue).
Figure 2
Figure 2
GBS spacer affects the conformation of the D-loop. (a) Comparison of 15N HSQC spectra of GR DBD – GBS complexes that differ at spacer only (Sgk and Sgk-ggg) or at spacer and half-site (Sgk and Gilz, Sgk-ggg and Gilz). (b) Zoomed spectra showing the chemical shift perturbation of D-loop residues Ala477 and Gly478 resulting from changing specific nucleotides in the spacer or half-site13:15. (c) The magnitude of combined 1H and 15N chemical shift difference between GR DBD – Sgk and GR DBD – Sgk-ggg spectra for each assigned residue, colored onto the crystal structure (PDB ID:3g6u). Unassigned residues are colored white. (d) Chemical shift difference (C.S.D.) analysis for pair wise comparison of GR DBD complexes with TTT compared to TTG spacer (top), or TGTTCT compared to TGTCCG half-site (bottom). Peaks unambiguously arising from peak splitting were assigned to their corresponding residues and C.S.D. values for both peaks are plotted. Grey bars indicate residues that have a C.S.D. greater or equal to the mean C.S.D. across pair wise comparisons. UA = unassigned.
Figure 3
Figure 3
Disrupting the dimerization interface affects lever arm and DNA recognition helix conformation. (a) Comparison of transcriptional induction of GBS luciferase reporters in U2OS cells expressing either GR wild type (WT) or mutant (A477T) after treatment with 100 nM dex. Error is one s.d. of four or more independent experiments and significant differences in transcriptional response between WT and A477T were determined by 2-tailed t-Test (*p < 0.05). The transcriptional response of A477T is equivalent for Sgk compared to Sgk-ggg or Sgk-ttg, (p-value = 0.44 and 0.19, respectively). (b) 15N-HSQC comparing WT and A477T DBD bound to the Fkbp5 GBS. (c) Magnitude of combined 1H and 15N chemical shift difference between WT and A477T DBD bound to the Fkbp5 GBS, colored onto the WT DBD crystal structure (PDB ID 3g6u). Unassigned WT residues are colored white. (d) Chemical shift difference (C.S. Diff.) between spectra of WT DBD and A477T DBD complexes. Grey bars highlight residues with a chemical shift difference ≥0.05ppm between WT and A477T across all three GBSs. UA = unassigned.
Figure 4
Figure 4
A477T impairs dimerization but not monomer DNA-binding. Electrophoretic mobility shift assay (EMSA) monitoring binding of WT or A477T DBD to (a) GBSs conjugated with an Alexa-488 fluorophore at a concentration of 5 nM or to (b) mutated GBSs, where one half-site is changed to the least favorable nucleotide at each position, based on the ChIP-seq binding motif in Fig. 1a. (c) Quantitative comparison of WT DBD (open squares) or A477T DBD (filled triangles) binding by EMSA. Error bars are one s.d. for 2–4 replicates.
Figure 5
Figure 5
A477T disrupts cooperativity and GBS-specific dissociation. (a) Representative SPR binding traces for WT and A477T DBD binding to immobilized GBSs at 35°C. Comparison of dissociation curves for WT DBD (top right) and A477T DBD (bottom right) (b) Binding isotherms for a GR DBD concentration series (0.700–200 nM for WT, 1.4–400 nM for A477T) binding to immobilized GBS surfaces at 35°C from 3 separate titrations, normalized to maximal binding. Isotherms were fit to the Hill equation: Fractional occupancy = (c/(c+K1/2))nH. (c) Comparison of transcriptional activity (fold induction) versus binding affinity (K1/2) or dissociation half-life (t1/2), for WT DBD (blue) and A477T DBD (red) across seven GBS surfaces at 8°C.
Figure 6
Figure 6
Sequence-specific lever arm conformation is dependent on the intact dimerization interface. (a) 15N-HSQC zoomed on the Gly470 peak of the lever arm of WT DBD bound to the asymmetric GBSs (Gilz, Sgk, Pal-ttg) and a palindromic site (Pal-R). Overlay of Gly470 peaks from all for GBSs for WT and A477T DBD (far right). (b) The peak intensity for Gly470 and Ile484 WT DBD residues in ZZ-exchange spectra at five mixing periods. The auto peak and the corresponding exchange peak are shaded equivalently. Insets show the spectra for auto and exchange peaks at a mixing period of 0.2 s. (c) Model showing the role of the dimerization interface in defining GBS-specific conformations. Both half-sites and the spacer determine the conformation of each GR dimer partner by transmitting information from the adjacent GBS half-site across the dimerization interface (represented by the colored arrows). Disruption of the dimerization interface by A477T impairs signal transmission and results in lever arm conformations that are insensitive to GBS sequence. (d) Comparison of WT and A477T chemical shift variance among seven GBS complexes colored by amino acid onto the GR DBD crystal structure.

References

    1. Yamamoto K, Darimont B, Wagner R, Iniguez-Lluhi J. Building transcriptional regulatory complexes: signals and surfaces. Cold Spring Harbor Symposia on Quantitative Biology. 1998;63:587–598. - PubMed
    1. Rosenfeld MG, Lunyak VV, Glass CK. Sensors and signals: a coactivator/corepressor/epigenetic code for integrating signal-dependent programs of transcriptional response. Genes & Development. 2006;20:1405–1428. - PubMed
    1. Ricketson D, Hostick U, Fang L, Yamamoto K, Darimont B. A conformational switch in the ligand-binding domain regulates the dependence of the glucocorticoid receptor on Hsp90. J Mol Biol. 2007;368:729–741. - PMC - PubMed
    1. Garza AMS, Khan SH, Kumar R. Site-specific phosphorylation induces functionally active conformation in the intrinsically disordered N-terminal activation function (AF1) domain of the glucocorticoid receptor. Mol Cell Biol. 2010;30:220–230. - PMC - PubMed
    1. Bledsoe RK, et al. Crystal structure of the glucocorticoid receptor ligand binding domain reveals a novel mode of receptor dimerization and coactivator recognition. Cell. 2002;110:93–105. - PubMed

Publication types

MeSH terms