. 2013 Jul;15(7):846-52.
doi: 10.1038/ncb2766. Epub 2013 Jun 2.

BMI1 represses Ink4a/Arf and Hox genes to regulate stem cells in the rodent incisor

Affiliations

BMI1 represses Ink4a/Arf and Hox genes to regulate stem cells in the rodent incisor

Brian Biehs et al. Nat Cell Biol. 2013 Jul.

Abstract

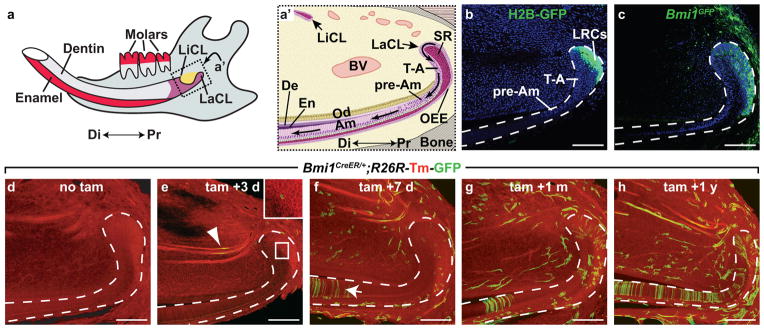
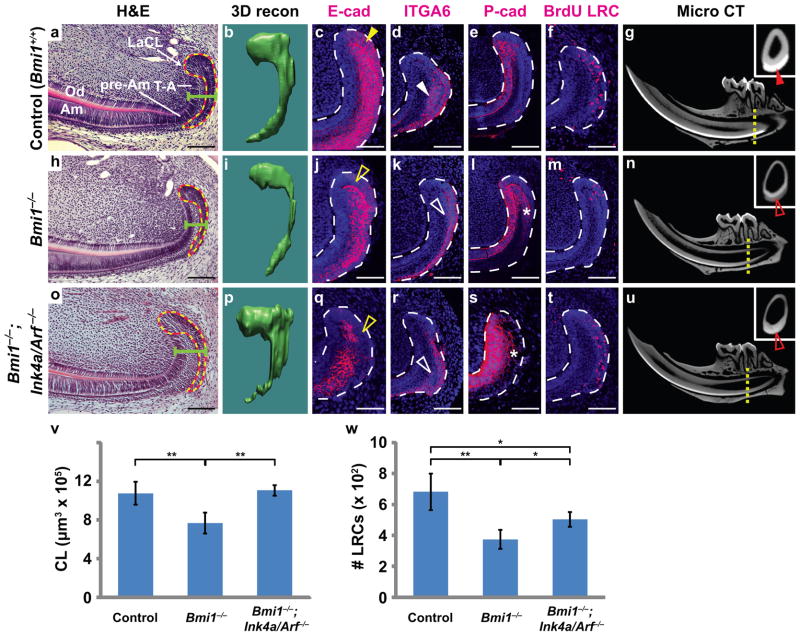
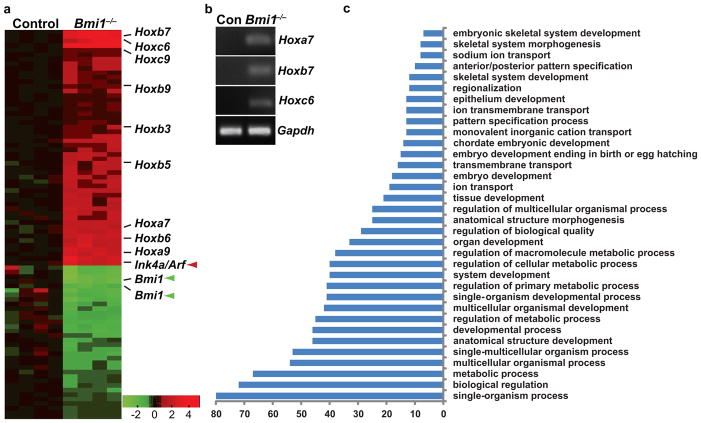
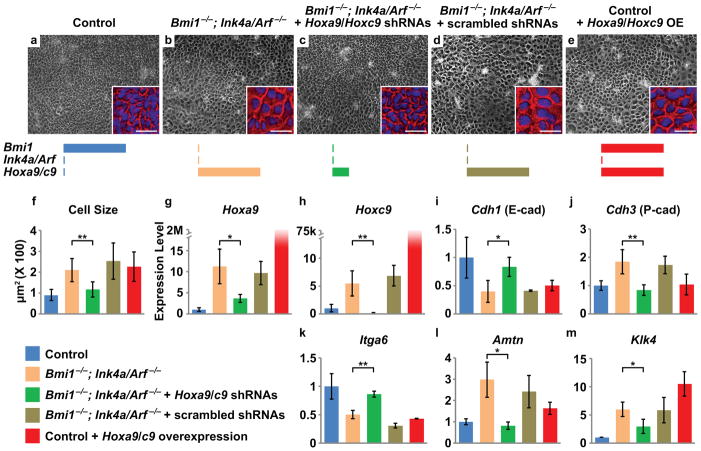
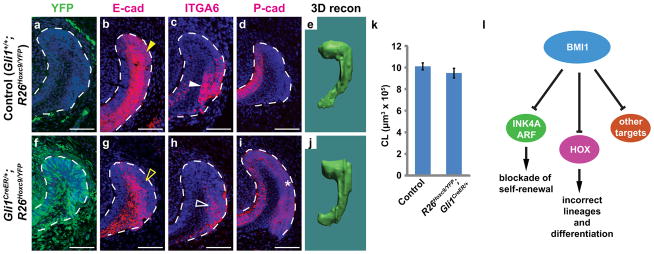
The polycomb group gene Bmi1 is required for maintenance of adult stem cells in many organs. Inactivation of Bmi1 leads to impaired stem cell self-renewal due to deregulated gene expression. One critical target of BMI1 is Ink4a/Arf, which encodes the cell-cycle inhibitors p16(Ink4a) and p19(Arf). However, deletion of Ink4a/Arf only partially rescues Bmi1-null phenotypes, indicating that other important targets of BMI1 exist. Here, using the continuously growing mouse incisor as a model system, we report that Bmi1 is expressed by incisor stem cells and that deletion of Bmi1 resulted in fewer stem cells, perturbed gene expression and defective enamel production. Transcriptional profiling revealed that Hox expression is normally repressed by BMI1 in the adult, and functional assays demonstrated that BMI1-mediated repression of Hox genes preserves the undifferentiated state of stem cells. As Hox gene upregulation has also been reported in other systems when Bmi1 is inactivated, our findings point to a general mechanism whereby BMI1-mediated repression of Hox genes is required for the maintenance of adult stem cells and for prevention of inappropriate differentiation.


Figures

Figure 1
Figure 1. Bmi1-expressing cells in the dental epithelium are stem cells
(a) Schematic diagram of an adult mandible. The incisor is a long tooth that grows under the molars. Enamel is produced by ameloblasts, which are present only on the labial surface. Dentin, produced by odontoblasts, is deposited on both the labial and lingual surfaces. Di, distal. LiCL, lingual cervical loop. LaCL, labial cervical loop. Pr, proximal. (a′) Schematic representation of the cell types associated with the dental epithelium and stem cell niche. Arrows in labial epithelium represent direction of movement of cells as they differentiate. Am, ameloblasts. BV, blood vessel. De, dentin. En, enamel. Od, odontoblasts. OEE, outer enamel epithelium. pre-AM, pre-ameloblasts. SR, stellate reticulum. T-A, transit amplifying. (b) K5tTA;H2BGFP mice treated for 2 months with doxycycline reveal label retention in the SR and OEE of the labial cervical loop. LRC, label retaining cells. (c) Bmi1GFP expression is localized to the OEE and SR of the cervical loop. (dh) Bmi1CreER;R26R-Tm-GFP mice were induced at 6 weeks with tamoxifen and chased for the indicated time period. Dotted lines in b–h outline the dental epithelium. Scale bar = 100 μm.
Figure 2
Figure 2. Deletion of Bmi1 affects adult LaCL through both Ink4a/Arf-dependent and independent mechanisms
(a,h,o) Haematoxylin and eosin staining comparing LaCLs from 5-month-old control (Bmi1+/+), Bmi1−/−, and Bmi1−/−;Ink4a/Arf−/− mice. Dotted lines outline region traced on coronal sections for 3-dimensional (3D) renderings. Green bar demarcates width of cervical loop. (b,i,p) 3D renderings enable reconstruction (recon) of the control, Bmi1−/− and Bmi1−/−;Ink4a/Arf−/− (triple mutant) LaCLs. (c,j,q) E-cadherin staining of the LaCL in control, Bmi1, and triple mutants. E-cadherin expression is downregulated in both the single and triple mutants (open yellow arrowheads) when compared to the control (yellow arrowhead). (d,k,r) Expression of ITGA6 detected by immunostaining is decreased in the Bmi1−/− and Bmi1−/−;Ink4a/Arf−/− LaCLs (open white arrowheads) compared to the control (white arrowhead). (e,l,s) P-cadherin expression in the LaCL is expanded in both the Bmi1 and Bmi1−/−;Ink4a/Arf−/− LaCLs (asterisks). (f,m,t) Representative sections of LaCLs from control, Bmi1−/−, and Bmi1−/−;Ink4a/Arf−/− jaws. Animals were pulsed with BrdU post-natally and aged for 1.5 months for identification of label-retaining cells (LRCs). (g,n,u) MicroCT scans showing mandibles from 5-month-old control, Bmi1−/− and Bmi1−/−;Ink4a/Arf−/− mice. Enamel is thinner and less mineralized in both single and triple mutants when compared to the control. Insets are coronal sections through the distal root of the second molar (yellow dotted lines) and show that enamel is less mineralized in mutants (open red arrowheads) than in the control (red arrowhead). (v) Quantification of volume of the LaCL stem cell compartment in control, Bmi1−/−, and Bmi1−/−;Ink4a/Arf−/− (n = 4 mice for each genotype). (w) Quantification of BrdU LRCs by sectioning and staining through the entire LaCL (n = 5 control, 3 Bmi1−/−, and 4 Bmi1−/−;Ink4a/Arf−/− mice). Error bars indicate means ± s.d. * is p < 0.05, and ** is p < 0.001. Scale bar = 100 μm for a,h,o, and 75 μm for cf, jm, and qt. Source data of statistical analyses are shown in Supplementary Table S2 and S3.
Figure 3
Figure 3. Bmi1 suppresses expression of Ink4a/Arf and Hox genes
(a) Microarray analysis on Bmi1+/+ (control or con) and Bmi1−/− dental epithelia shows that inactivation of Bmi1 leads to de-regulation of several Hox genes, in addition to Ink4a/Arf (red arrowhead). Loss of Bmi1 expression is indicated by green arrowheads. (b) RT-PCR analysis showing upregulation of Hoxa7, b7, and c6 in Bmi1−/− LaCLs. (c) Gene ontology analysis reveals upregulation of genes normally involved in developmental processes and cell differentiation.
Figure 4
Figure 4. Hox gene upregulation contributes to the Bmi1 loss of function phenotype
(a) Stem cell colonies derived from control LaCLs are composed of small, rounded cells. (b) Deletion of Ink4a/Arf enables colony formation by Bmi1−/− cells, but cell size is increased. (c) Knockdown of Hoxa9 and Hoxc9 rescues the morphological defects in Bmi1−/−;Ink4a/Arf−/− colonies. (d) Scrambled shRNA does not rescue the phenotype. (e) Overexpression of Hoxa9 and Hoxc9 in control cells phenocopies the morphology of Bmi1−/−;Ink4a/Arf−/− colonies. Insets in ae are enlarged images of representative cells with pseudo-colored cell boundary (red) and DAPI nuclear staining (blue). Schematics represent the level of expression for each gene. (f) Quantification of cell size under different conditions (n = 3 independent experiments with 100 cells scored for each experiment). (gm) Relative expression level by qPCR of Hoxa9, Hoxc9, Cdh1, Cdh3, Itga6, Amtn, and Klk4 in cells cultured under different conditions (n = 3 independent experiments). Error bars indicate means ± s.d. * is p < 0.05, and ** is p < 0.001. Scale bar = 100 μm for ae and 30 μm for the insets. Source data of statistical analyses are shown in Supplementary Table S4 and S5.
Figure 5
Figure 5. Overexpression of Hoxc9 in LaCLs phenocopies Bmi1 mutants
(a,f) Hoxc9 and YFP Cre-reporter were overexpressed using a Gli1CreER driver in the LaCL by tamoxifen induction, but not in the absence of Cre. YFP expression is shown here 10 days after induction. (b,g) E-cadherin is expressed in SR and OEE in the control LaCL (yellow arrowhead) but downregulated in the mutant (open yellow arrowhead). (c,h) ITGA6 is similarly downregulated in the mutant (compare solid and open white arrowheads). (d,i) P-cadherin expression is restricted in the T-A region in the control but expanded in the mutant (asterisk). All LaCLs are outlined by white dashed lines. Scale bar = 75 μm. (e,j,k) 3D reconstruction (recon) of LaCLs shows no difference in LaCL size between control and Gli1CreER/+;R26Hoxc9/YFP (n = 3 animals for each genotype). Error bars indicate means ± s.d. Source data of statistical analysis are shown in Supplementary Table S2. (i) Model for function of BMI1 in incisor stem cells.

References

    1. Molofsky AV, et al. Bmi-1 dependence distinguishes neural stem cell self-renewal from progenitor proliferation. Nature. 2003;425:962–967. - PMC - PubMed
    1. Park IK, et al. Bmi-1 is required for maintenance of adult self-renewing haematopoietic stem cells. Nature. 2003;423:302–305. - PubMed
    1. Jacobs JJ, Kieboom K, Marino S, DePinho RA, van Lohuizen M. The oncogene and Polycomb-group gene bmi-1 regulates cell proliferation and senescence through the ink4a locus. Nature. 1999;397:164–168. - PubMed
    1. Molofsky AV, He S, Bydon M, Morrison SJ, Pardal R. Bmi-1 promotes neural stem cell self-renewal and neural development but not mouse growth and survival by repressing the p16Ink4a and p19Arf senescence pathways. Genes Dev. 2005;19:1432–1437. - PMC - PubMed
    1. Zacharek SJ, et al. Lung stem cell self-renewal relies on BMI1-dependent control of expression at imprinted loci. Cell Stem Cell. 2011;9:272–281. - PMC - PubMed

Publication types

Substances