. 2013 Jul;41(Web Server issue):W398-405.
doi: 10.1093/nar/gkt453. Epub 2013 May 31.

BeEP Server: Using evolutionary information for quality assessment of protein structure models

Affiliations

BeEP Server: Using evolutionary information for quality assessment of protein structure models

Nicolas Palopoli et al. Nucleic Acids Res. 2013 Jul.

Abstract

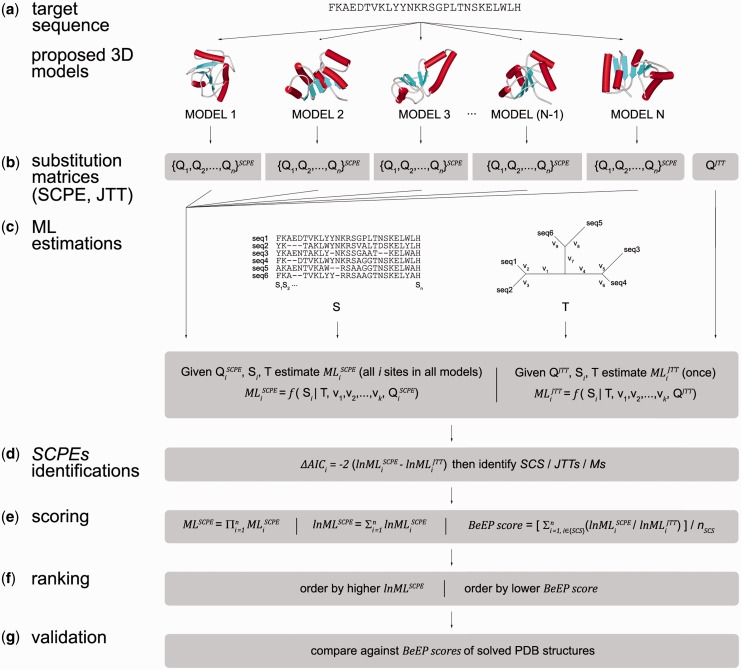
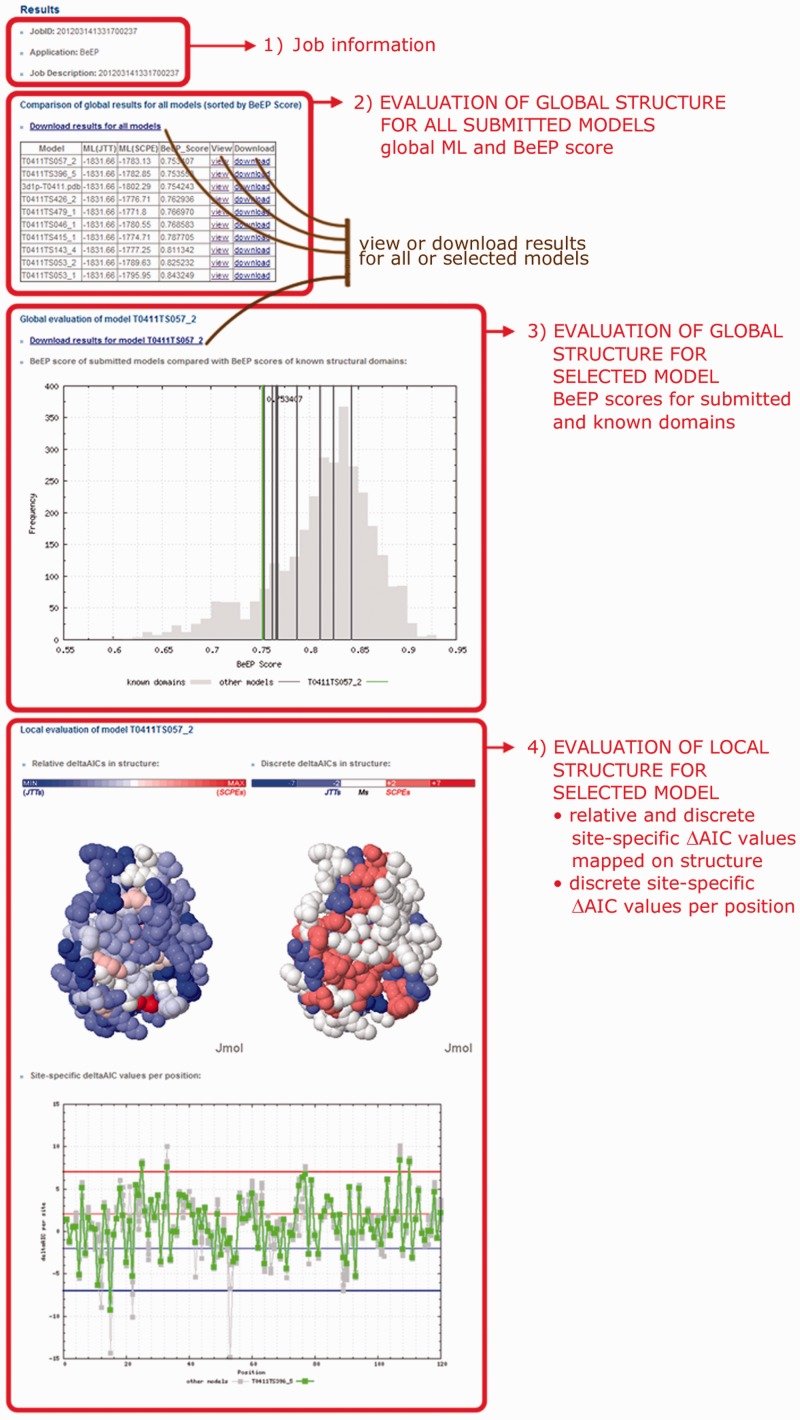
The BeEP Server (http://www.embnet.qb.fcen.uba.ar/embnet/beep.php) is an online resource aimed to help in the endgame of protein structure prediction. It is able to rank submitted structural models of a protein through an explicit use of evolutionary information, a criterion differing from structural or energetic considerations commonly used in other assessment programs. The idea behind BeEP (Best Evolutionary Pattern) is to benefit from the substitution pattern derived from structural constraints present in a set of homologous proteins adopting a given protein conformation. The BeEP method uses a model of protein evolution that takes into account the structure of a protein to build site-specific substitution matrices. The suitability of these substitution matrices is assessed through maximum likelihood calculations from which position-specific and global scores can be derived. These scores estimate how well the structural constraints derived from each structural model are represented in a sequence alignment of homologous proteins. Our assessment on a subset of proteins from the Critical Assessment of techniques for protein Structure Prediction (CASP) experiment has shown that BeEP is capable of discriminating the models and selecting one or more native-like structures. Moreover, BeEP is not explicitly parameterized to find structural similarities between models and given targets, potentially helping to explore the conformational ensemble of the native state.


Figures

Figure 1.
Figure 1.
Schematic representation of the BeEP workflow. Given a protein of interest with length n and different proposed structural models (a), the SCPE is used to derive a set of site-specific substitution matrices for each model (b). Using ML estimations, it is possible to evaluate the correlation of each substitution matrix with the information contained in a sequence alignment S of homologous proteins by optimizing the branch lengths on a corresponding phylogenetic tree T (c). The site-specific ML values obtained using SCPE matrices are compared with the ML values calculated with the substitution matrix QJTT of the unconstrained model JTT to identify sites subjected to structural constraints (SCS) (d). BeEP scores are derived from the site-specific ML (e) values and the set of structural models can be ranked through the comparison of these scores (f). Further validation of native-like models can be achieved by comparison with the BeEP scores of known structures (g).
Figure 2.
Figure 2.
BeEP score versus Cα-RMSD to target protein for all structural models in six example sets selected from CASP8 targets (from left to right and top to bottom: T0411, T0418_D1, T0420, T0426, T0427_D2, T0506_D1). Each grey circle corresponds to a decoy model. The target structure (at Cα-RMSD = 0) and the best decoy are shown in red squares.
Figure 3.
Figure 3.
Slight variations in residue environments can change the BeEP score and increase the discrimination of decoys. In panel (a), we show the structural alignment between target structure T0426 (cyan) and the best decoy (light green) according to BeEP, which is ranked better than the target itself (see also Figure 2). Structural variations between target and best decoy produce changes in physicochemical environments of the residues favouring SCPE or JTT models. Derived SCPE (in red) and JTT (blue) sites are displayed in panel (b). The number of SCS in the target and in the best decoy is 106 and 103, respectively. However, the BeEP score accounts for the difference in the likelihood between SCPE and JTT models in SCS sites (see BeEP score equation in Methods). In panel (c), we show two examples of how different residues rearrangements could favour the occurrence of given residues and then increase SCPE likelihood in the best decoy against the target structure. In panel c, left, a pair of arginine (Arg) and phenylalanine (Phe) show a better geometry to form a pi-cation interaction in the best decoy. In panel c, right, the distance to establish a Coulomb interaction between aspartate (Asp) and lysine (Lys) residues is better in the best decoy than in the target structure.
Figure 4.
Figure 4.
BeEP Server output explanation. The red boxes indicate different sections in the output. 1) Job information. The JobID can be used to retrieve results after the run has finished. 2) Table summarizing results of the global assessment of submitted protein structure models. For each submitted model, the table shows the global ML values obtained with the JTT general substitution model and the SCPE site-specific substitution model, together with the BeEP score on which the table is ranked. Links are provided to download a compressed file with all the results generated by the run, both for the individual models and for the complete dataset, or to load the results for a selected model. 3) BeEP score of all submitted models plotted on top of the distribution of BeEP scores for PDB structures of known domains. The selected model is displayed in green. The BeEP scores of known domains are provided as a reference, with good structure models expected to tend to the left (low) end of the distribution. 4) Different representations of the selected model based on the local ΔAIC values. Site-specific scores are mapped on the structure in two different scales: the discrete colouring is useful for spotting SCS while the relative colouring can point to structurally conserved patches. A plot of site-specific ΔAIC values per position helps to identify contiguous regions of the protein subjected to structural constraints. The reference horizontal lines are coloured according to the scale of discrete ΔAIC values.

References

    1. Cozzetto D, Kryshtafovych A, Ceriani M, Tramontano A. Assessment of predictions in the model quality assessment category. Proteins. 2007;69(Suppl. 8):175–183. - PubMed
    1. Kryshtafovych A, Venclovas C, Fidelis K, Moult J. Progress over the first decade of CASP experiments. Proteins. 2005;61(Suppl. 7):225–236. - PubMed
    1. Moult J, Fidelis K, Kryshtafovych A, Rost B, Tramontano A. Critical assessment of methods of protein structure prediction - Round VIII. Proteins. 2009;77(Suppl. 9):1–4. - PubMed
    1. Cozzetto D, Kryshtafovych A, Fidelis K, Moult J, Rost B, Tramontano A. Evaluation of template-based models in CASP8 with standard measures. Proteins. 2009;77(Suppl. 9):18–28. - PMC - PubMed
    1. Tsai CJ, Kumar S, Ma B, Nussinov R. Folding funnels, binding funnels, and protein function. Protein Sci. 1999;8:1181–1190. - PMC - PubMed

Publication types