

Application of Raman spectroscopy to identify microcalcifications and underlying breast lesions at stereotactic core needle biopsy
- PMID: 23729641
- PMCID: PMC3754785
- DOI: 10.1158/0008-5472.CAN-12-2313
Application of Raman spectroscopy to identify microcalcifications and underlying breast lesions at stereotactic core needle biopsy
Abstract
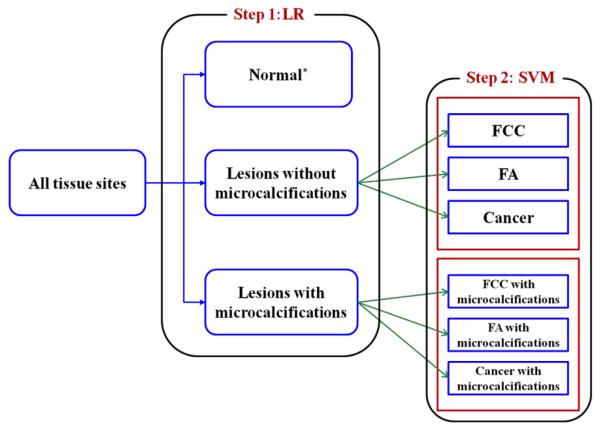
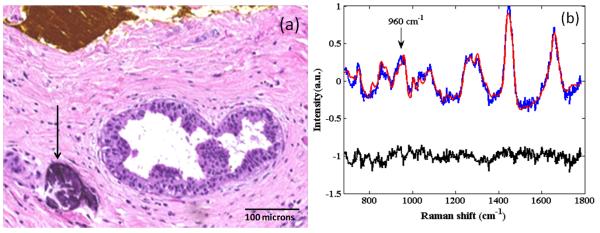
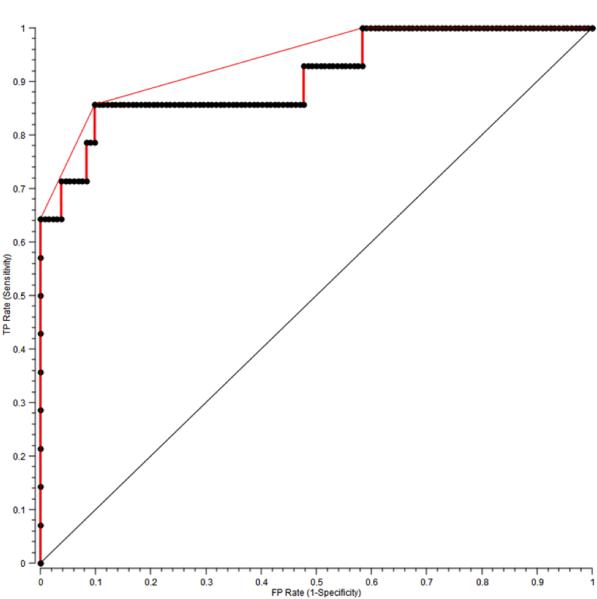
Microcalcifications are a feature of diagnostic significance on a mammogram and a target for stereotactic breast needle biopsy. Here, we report development of a Raman spectroscopy technique to simultaneously identify microcalcification status and diagnose the underlying breast lesion, in real-time, during stereotactic core needle biopsy procedures. Raman spectra were obtained ex vivo from 146 tissue sites from fresh stereotactic breast needle biopsy tissue cores from 33 patients, including 50 normal tissue sites, 77 lesions with microcalcifications, and 19 lesions without microcalcifications, using a compact clinical system. The Raman spectra were modeled on the basis of the breast tissue components, and a support vector machine framework was used to develop a single-step diagnostic algorithm to distinguish normal tissue, fibrocystic change (FCC), fibroadenoma, and breast cancer, in the absence and presence of microcalcifications. This algorithm was subjected to leave-one-site-out cross-validation, yielding a positive predictive value, negative predictive value, sensitivity, and specificity of 100%, 95.6%, 62.5%, and 100% for diagnosis of breast cancer (with or without microcalcifications) and an overall accuracy of 82.2% for classification into specific categories of normal tissue, FCC, fibroadenoma, or breast cancer (with and without microcalcifications). Notably, the majority of breast cancers diagnosed are ductal carcinoma in situ (DCIS), the most common lesion associated with microcalcifications, which could not be diagnosed using previous Raman algorithm(s). Our study shows the potential of Raman spectroscopy to concomitantly detect microcalcifications and diagnose associated lesions, including DCIS, and thus provide real-time feedback to radiologists during such biopsy procedures, reducing nondiagnostic and false-negative biopsies.
©2013 AACR.
Figures
References
-
- American Cancer Society . Breast Cancer Facts & Figures 2011-2012. American Cancer Society, Inc.; Atlanta:
-
- Rim A, Chellman-Jeffers M. Trends in breast cancer screening and diagnosis. Clev Clin J Med. 2008;75:S2–9. - PubMed
-
- Johnson JM, Dalton RR, Wester SM, Landercasper J, Lambert PJ. Histological correlation of microcalcifications in breast biopsy specimens. Arch Surg. 1999;134:712–715. - PubMed
-
- Markopoulos C, Kouskos E, Koufopoulos K, Kyriakou V, Gogas J. Use of artificial neural networks (computer analysis) in the diagnosis of microcalcifications on mammography. Eur J Radiol. 2001;39:60–5. - PubMed
-
- Betal D, Roberts N, Whitehouse GH. Segmentation and numerical analysis of microcalcifications on mammograms using mathematical morphology. Br J Radiol. 1997;70:903–17. - PubMed
Publication types
MeSH terms
Grants and funding
LinkOut - more resources
Full Text Sources
Other Literature Sources
Medical
